Interface Overview
If you are already a Ververica customer, you'll see many improvement in the latest version of the user interface. The main point of entry is still the Dashboard, and from there you can access all your workspaces, regardless of which deployment option you selected.
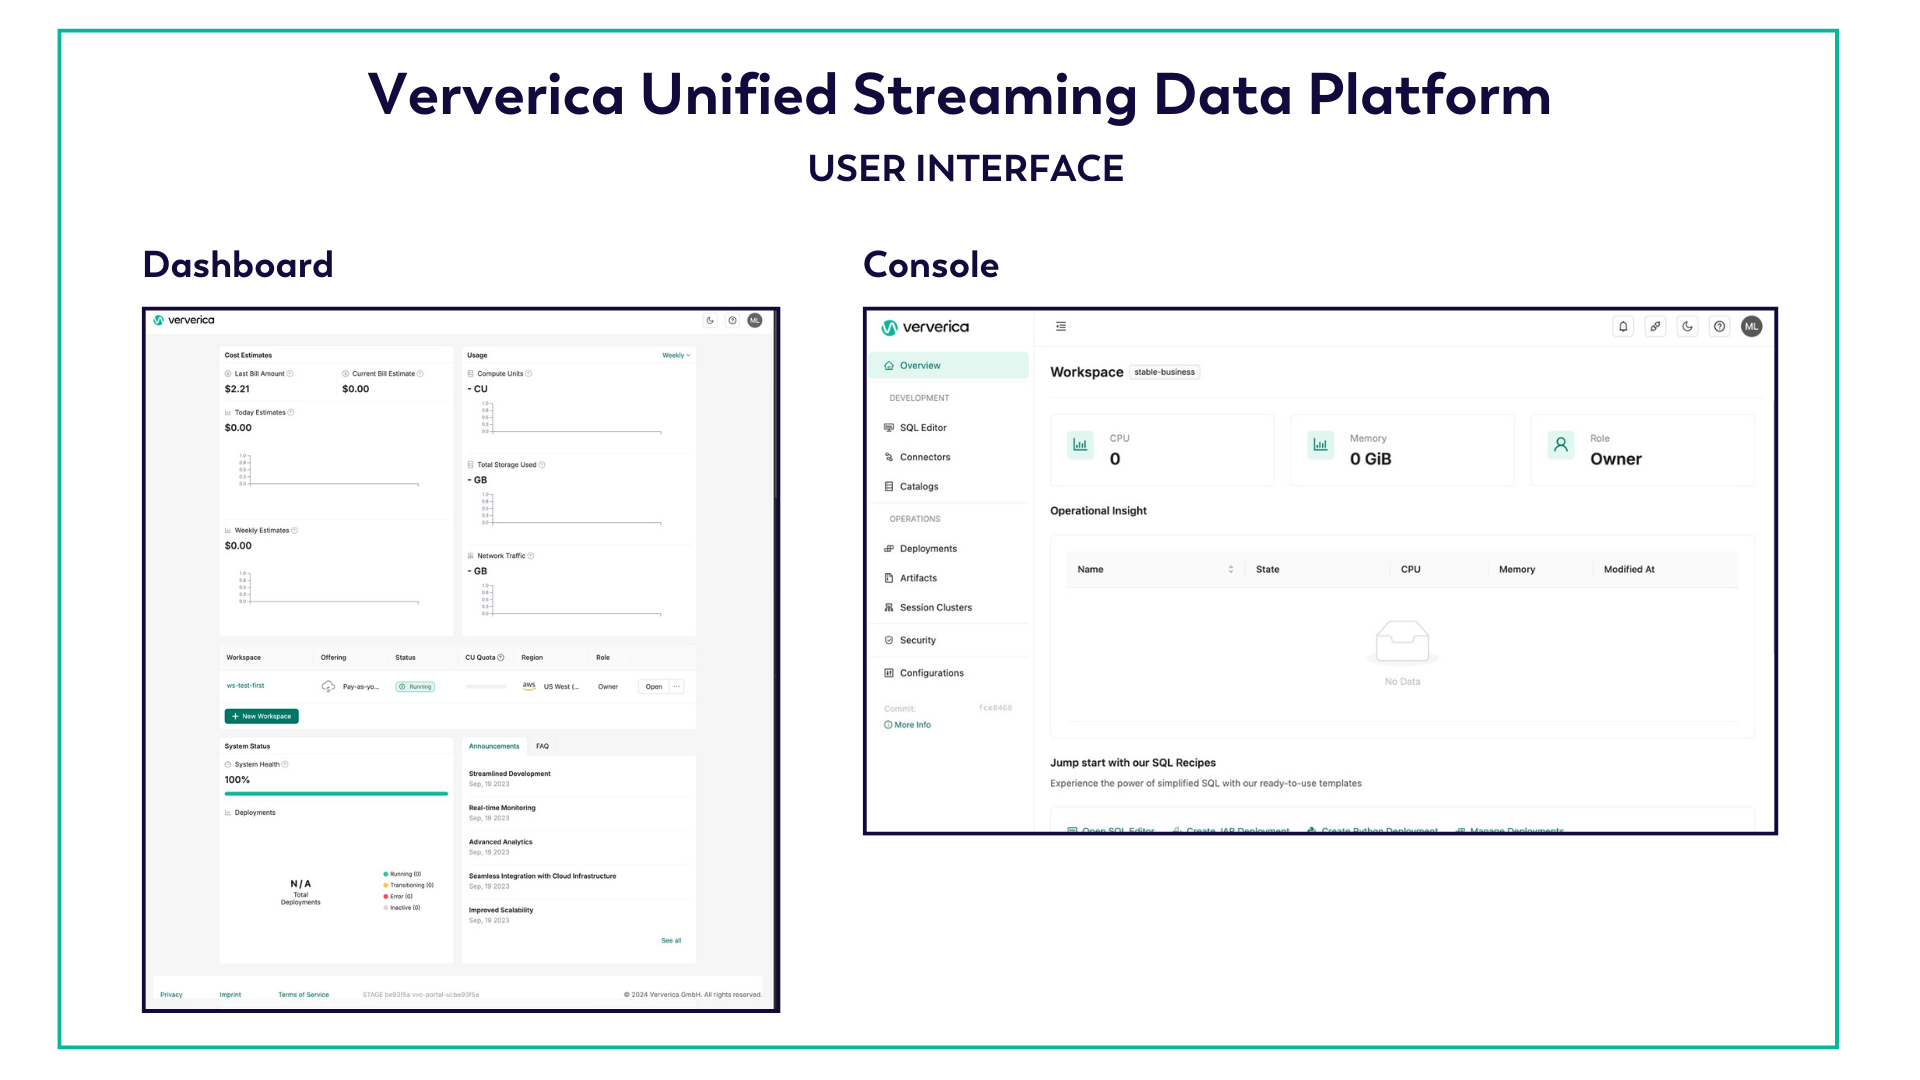
Ververica Unified Streaming Data Platform enables you to view, manage, observe, and troubleshoot your drafts and deployments. The interface offers two views into the platform: Dashboard and Console.

When you log into your Ververica Unified Streaming Data Platform account, the Dashboard is the first thing you see. It lists all your workspaces and summarizes costs, usage, and system status.
Use the Dashboard to:
- Create a new workspace
- Open the Console for an existing workspace
- Invite users to collaborate on a workspace
- Configure a private connection
- Delete a workspace
Use the Console to create, run, and debug your streaming applications.
Navigating the Interface
Both the Dashboard and Console views have their own navigation and menu options.
-
From the Dashboard menu, you can access your current profile, payment, and billing options.
-
The Console menu groups tasks by functionality:
- Overview: Get an overall view of the deployments in the current workspace
- Development: Use the SQL Editor, Connectors and Catalogs pages to manage drafts
- Operations: Use the pages in this section to manage deployments