Automated Exception Log Analysis
Log Analysis is the process of examining computer-generated event logs to identify issues, anomalies, or errors in a system or application. It involves reviewing log files that contain timestamped information events such as messages, error reports, file requests, file transfers, and sign-in/out requests. Log analysis is crucial for various purposes, including:
-
Bug Detection: Identifying and resolving software bugs or issues.
-
Security: Monitoring for security breaches and unauthorized access.
-
Performance Monitoring: Analyzing system or application performance.
-
Troubleshooting: Investigating issues or outages by reviewing historical logs.
-
Compliance: Ensuring that systems comply with regulatory requirements.
Log Analysis and Ververica Cloud
Ververica Cloud incorporates the Automated Exception Log Analysis tool to assist developers during the development and deployment of their Flink job applications. The feature is available in both the development and operational state of the job within the Ververica Cloud Console.
Development State Exception
The first occasion to utilize the Automated Exception Log Analysis feature in the Ververica Cloud Console is in the SQL Editor.
-
On the Dashboard page, open the console for the workspace you want to manage.
-
In the Console navigation pane, click SQL Editor.
-
Create a new draft.
-
Enter or copy/paste in the SQL code.
-
Click Validate to analyze the SQL.
The validation results will be displayed, and the information icon will indicate the Log Analysis Results.
The following image shows an example of what the log analysis displays in the pre-deployment phase of the application. In this case, the SQL syntax and network connectivity check fails, and the log analysis provides a ‘Cause’ and ‘Solution’ to the failed check.
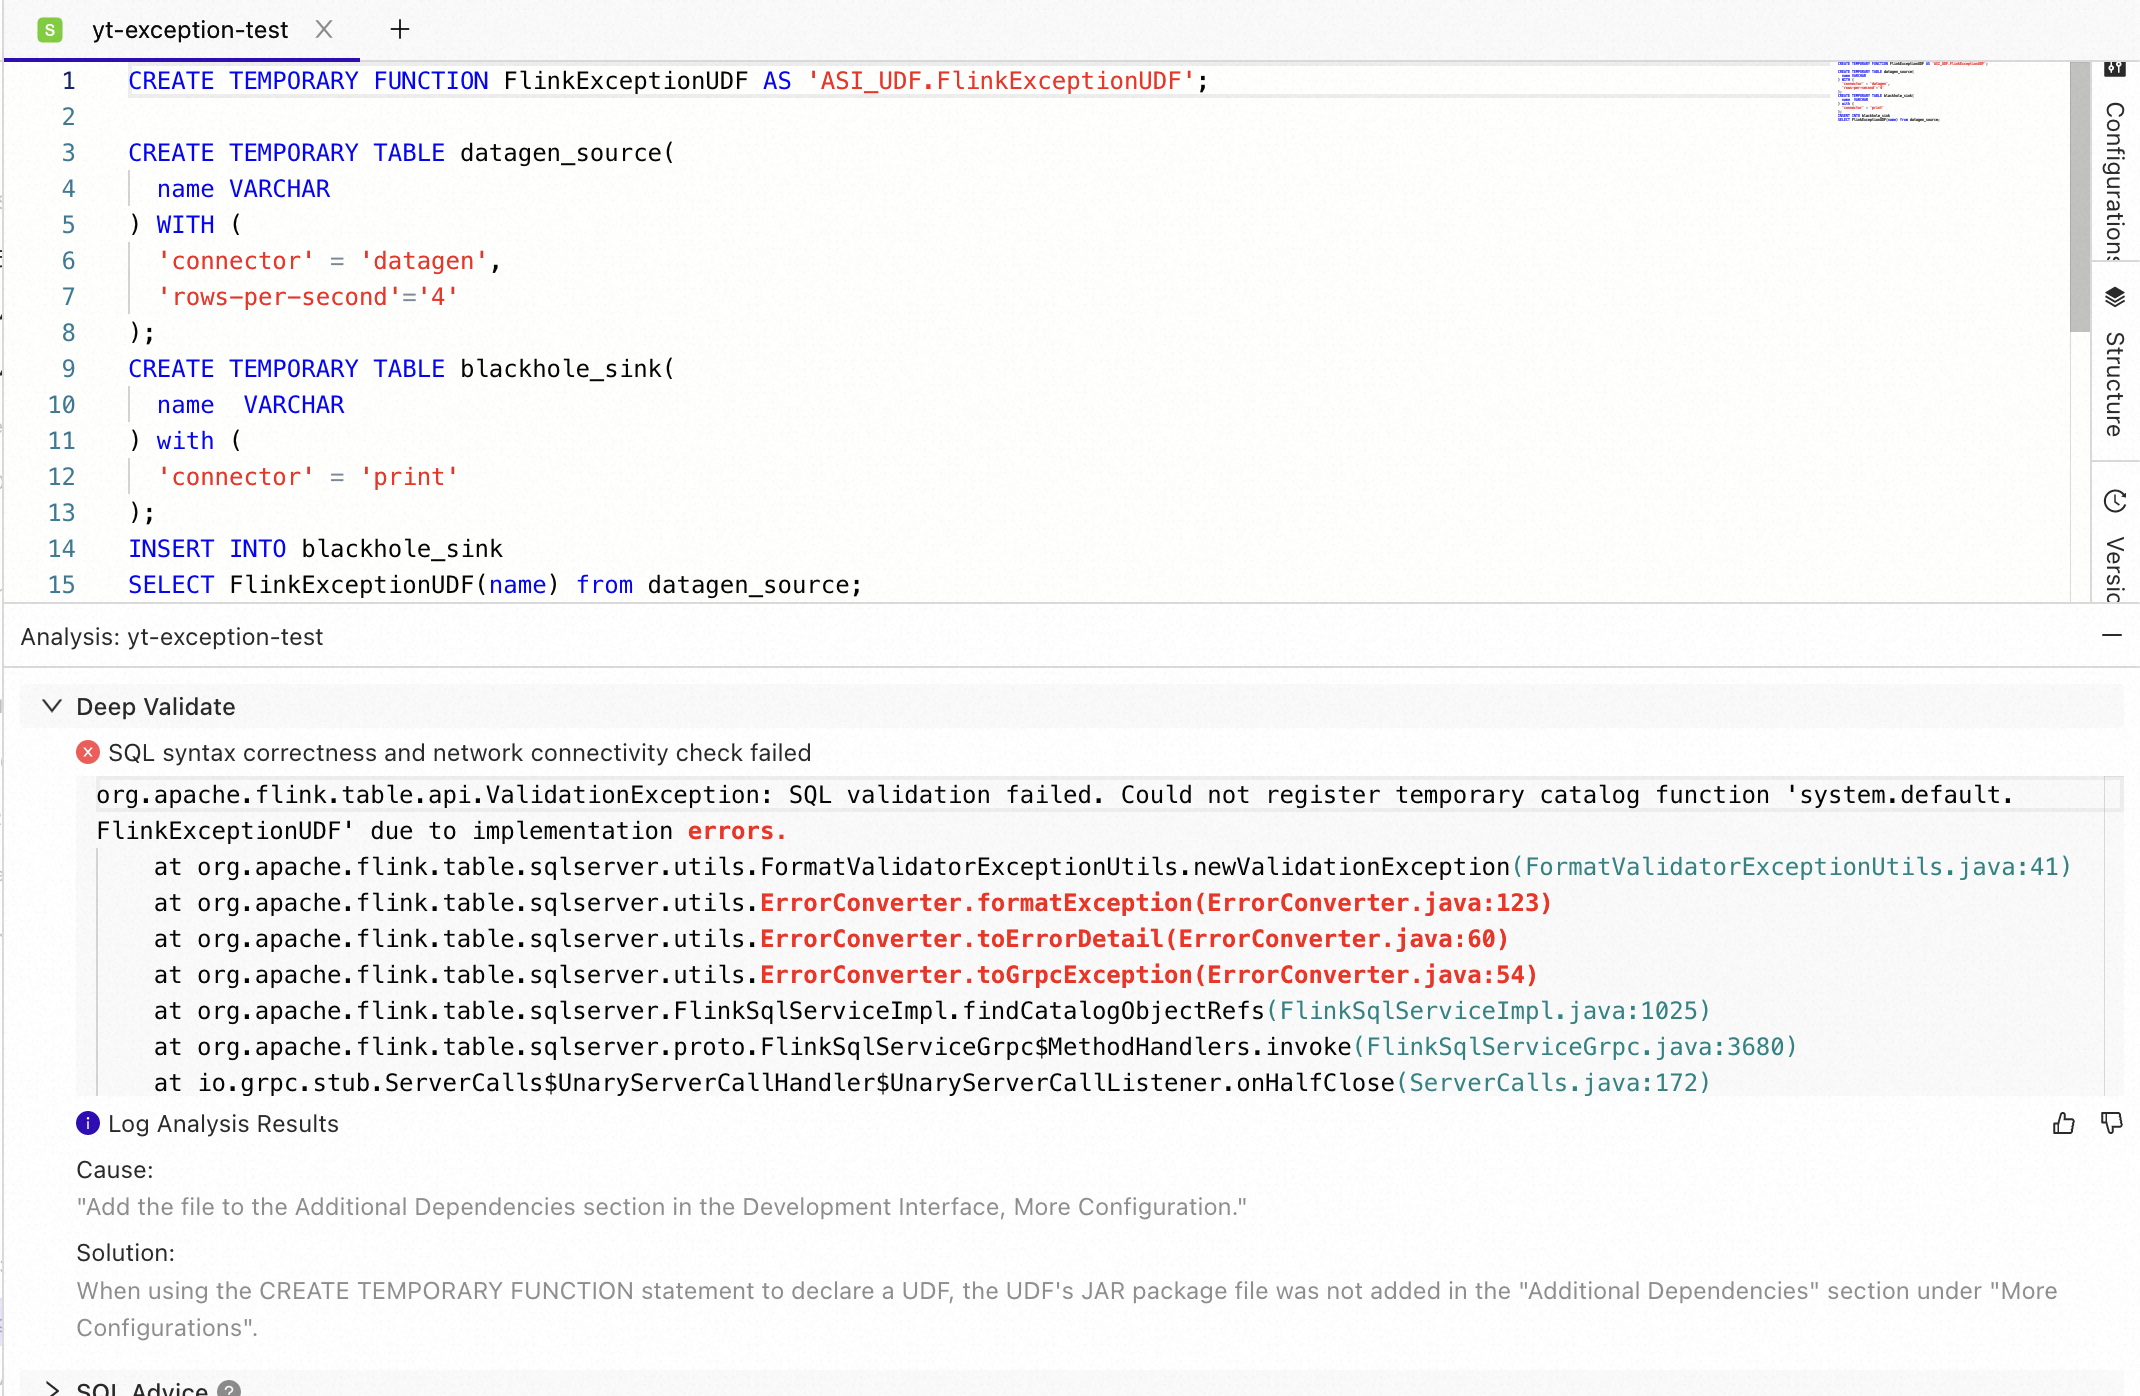
By analyzing the logs in the development stage, this feature proactively aids developers by equipping them with possible causes, solutions, and reference scenarios before deployment.
Operation State Exception
Like the development state, the Automated Exception Log Analysis tool is also available in deployments beyond the draft stage.
-
On the Dashboard page, open the console for the workspace you want to manage.
-
In the Console navigation pane, click Deployments.
-
Open the deployment to be analyzed and display the Diagnostics tab.
-
Display the JM Exceptions tab to examine the Log Analysis Results indicated by the information icon.
The screenshot below shows the analysis with an output of potential causes for errors and solutions to investigate. This example indicates a potential issue from a Java application and instructs the user to check out their UDFs.
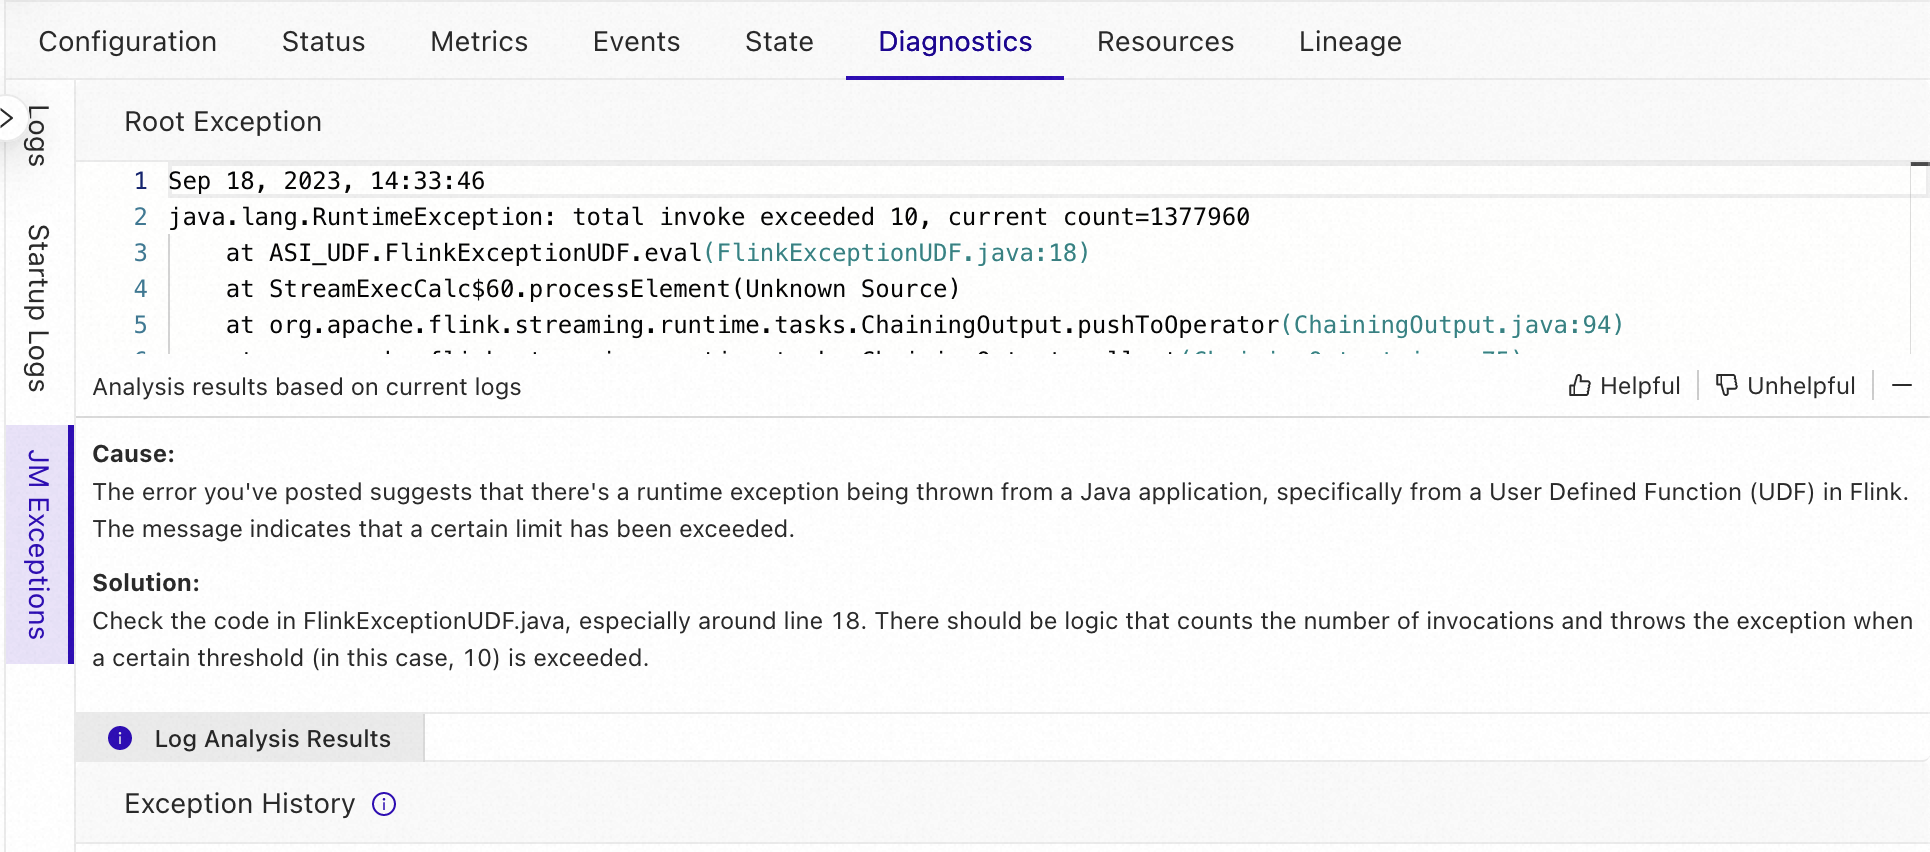
By getting log analysis at the deployment level, users can quickly understand issues with their applications with actionable solutions to save on time otherwise spent troubleshooting.