View Startup Logs and Running Logs of a Job
When a job is running, you can view the startup logs, running logs, and exceptions of the job. This page describes how to view a job's startup logs, running logs, and exceptions.
Background Information
The following table describes the supported log levels in ascending order of urgency:
| Item | Description |
|---|---|
| Running logs | You can view the logs of JobManager and TaskManagers on the Logs tab in the console. |
| Startup logs | After a job is started, the startup logs of the current job are generated. The startup logs are generated from the time the Ververica Cloud is initialized to the time the JobManager is started. For more information about how to view the startup logs of a job. Note: The startup logs do not include scheduling logs. You can view the scheduling logs on the Events tab. |
| JM Exceptions | You can view the exceptions of Job. |
Prerequisites
The instance of a job is in the Running state.
Precautions
Logs are displayed by page. Each page can display up to 1 MB of logs and approximately 8,000 to 9,000 rows of logs. In most cases, you can locate an issue based on the logs that are displayed on the first page. If you cannot locate the issue based on the logs that are displayed on the first page, go to the next page.
View the Running Logs of a Job
-
On the Dashboard page, open the console for the workspace you want to manage.
-
In the Console navigation pane, click Deployments.
-
Click the name of the desired deployment.
-
Click the Diagnostics tab.
-
Display the Logs tab.
-
View the logs of JobManager and TaskManagers.
- To view the logs of JobManager, click on the Job Manager tab >> the Logs tab.
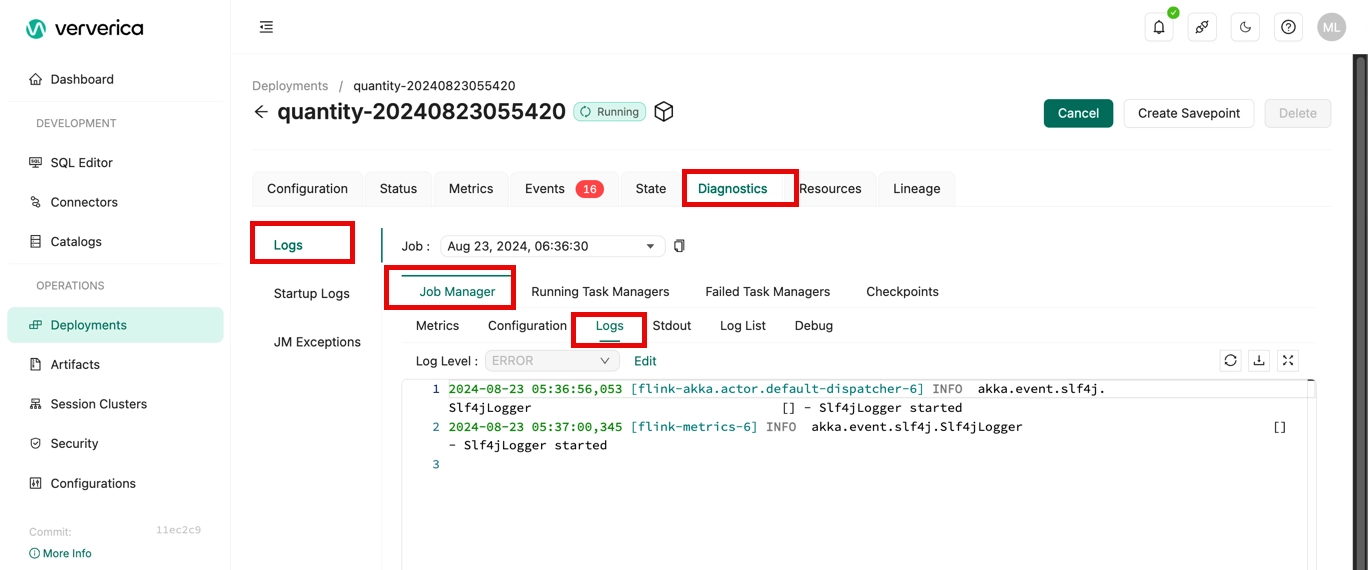
-
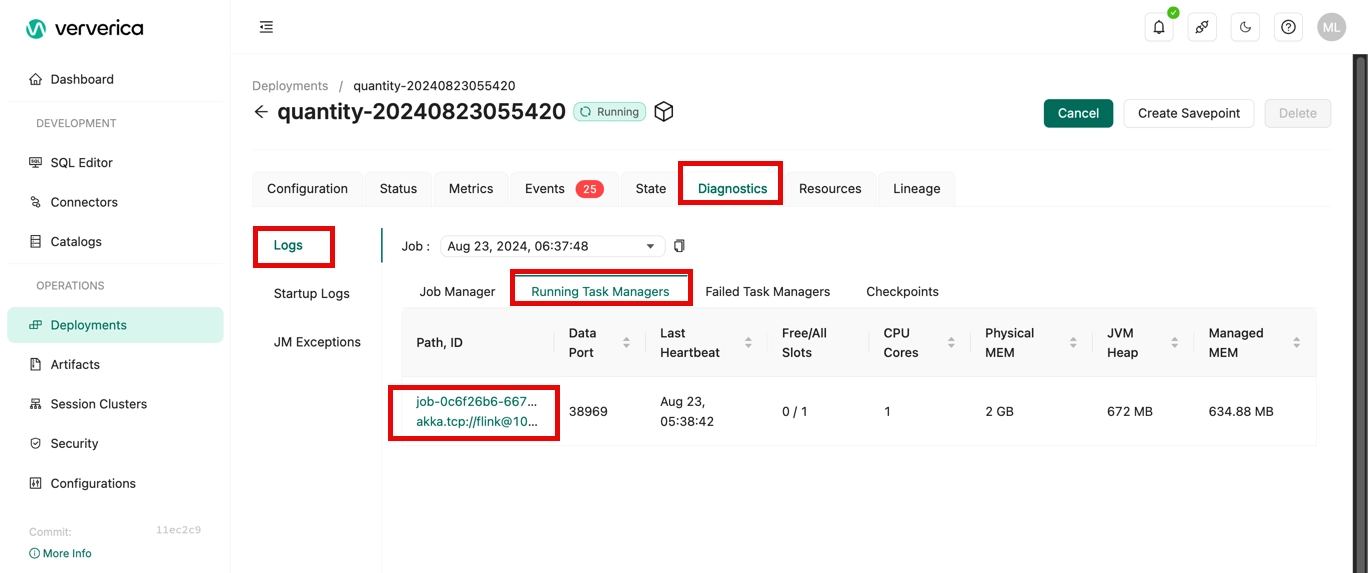
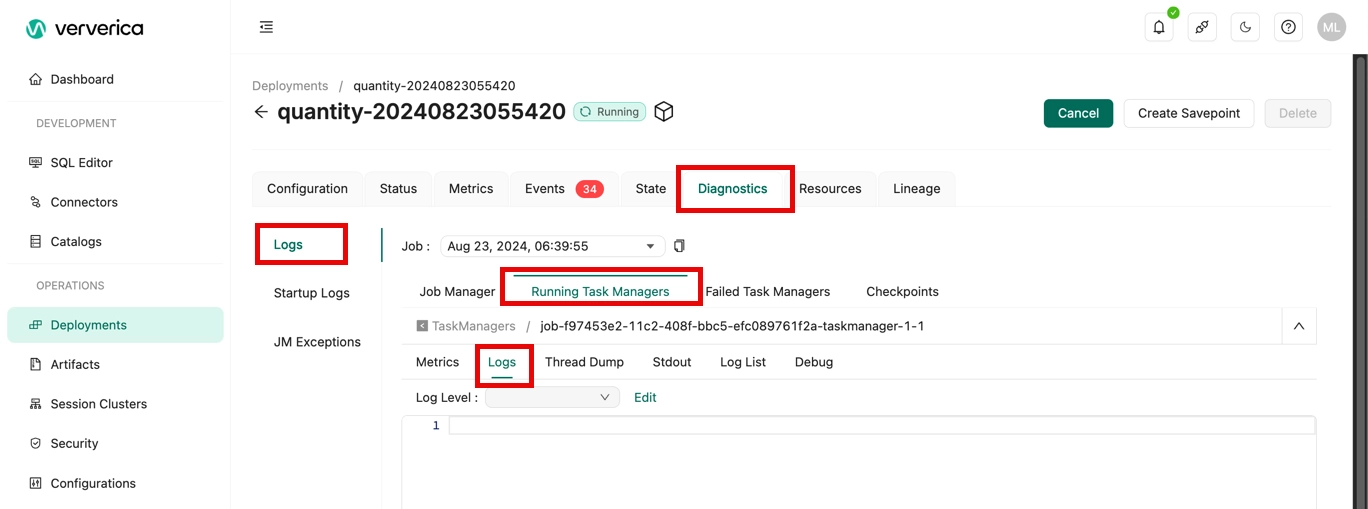
To view the logs of TaskManagers, click the value in the Path, ID column >> the Logs tab.
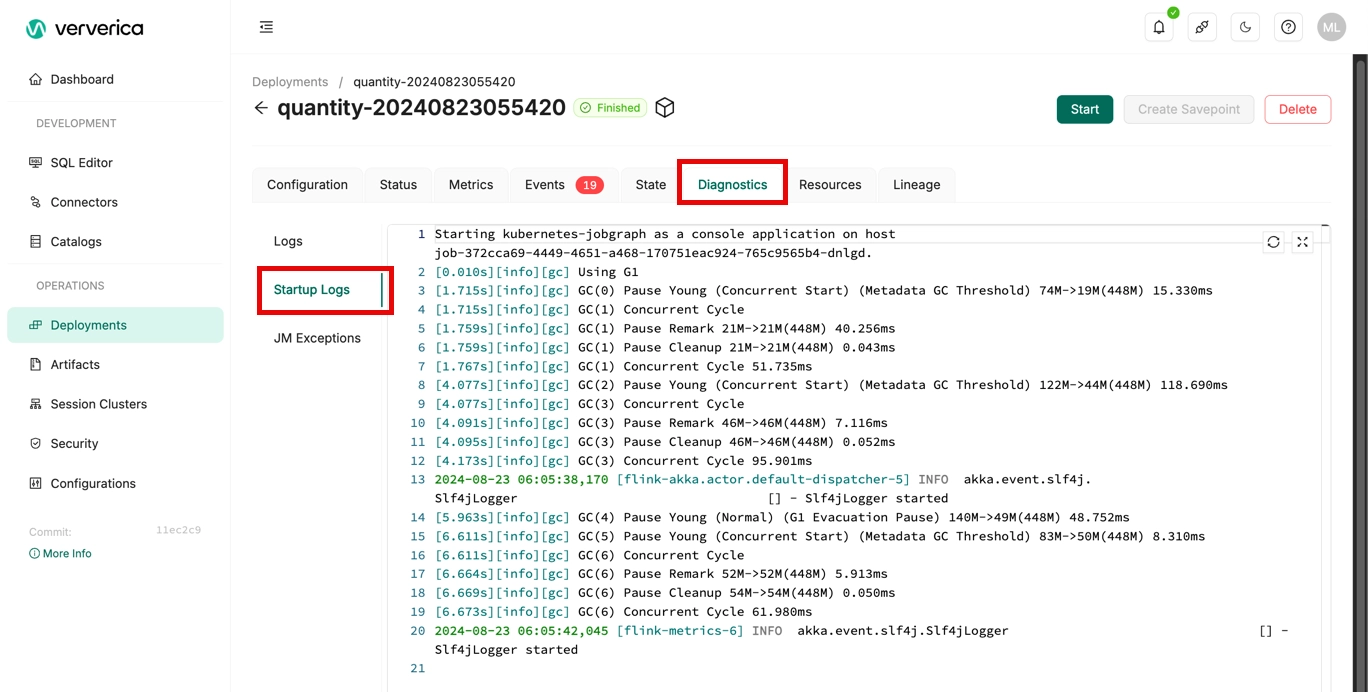
View the Startup Logs of a Job
-
On the Dashboard page, open the console for the workspace you want to manage.
-
In the Console navigation pane, click Deployments.
-
Click the name of the desired deployment.
-
Click the Diagnostics tab.
-
Display the Startup Logs tab.
View JM Exceptions of a Job
-
On the Dashboard page, open the console for the workspace you want to manage.
-
In the Console navigation pane, click Deployments.
-
Click the name of the desired deployment.
-
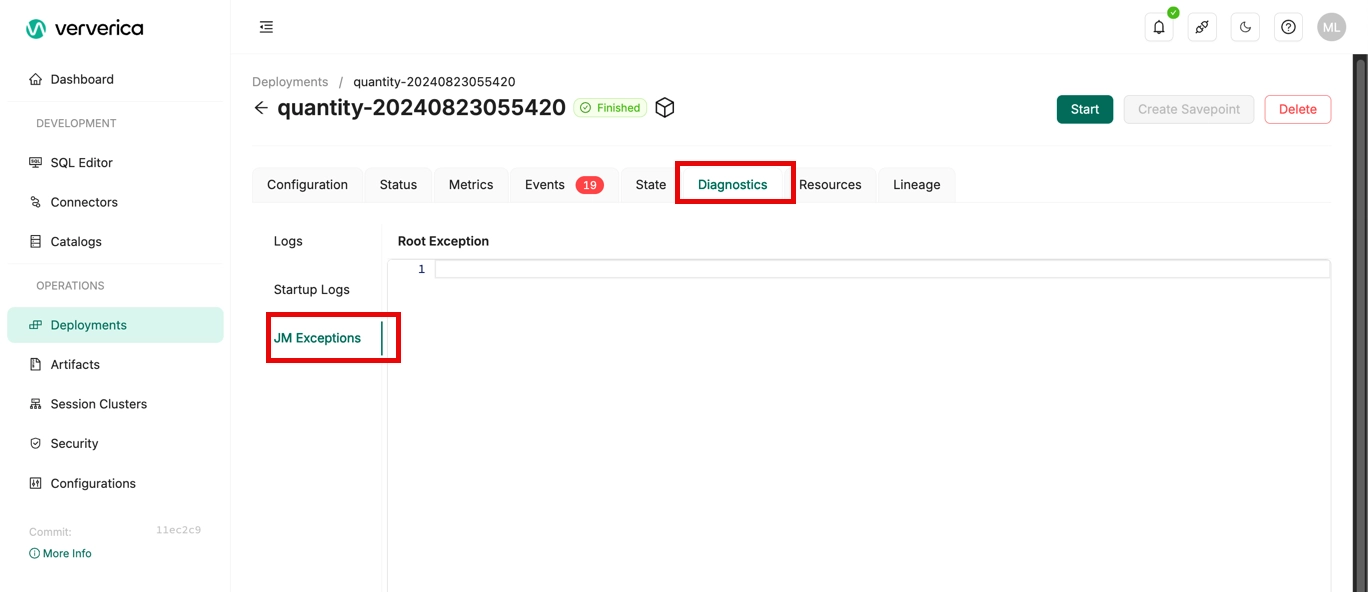
Click the Diagnostics tab.
-
Display the JM Exceptions tab, view the exception of the job.