Metrics
Ververica Cloud allows you to view the metrics of a deployment. This way, you can check whether the deployment data is normal. This page explains how to view the metrics of a deployment. This topic also describes the metrics that are supported by Flink sources and sinks and the connectors that are used to report metrics.
Background Information
Precautions
Metrics that are reported by a source reflect only the current situation of the source and cannot be used to identify the root cause of an issue. You need to use auxiliary metrics or tools to identify the root cause of an issue. The following table describes the analysis of metrics in specific scenarios:
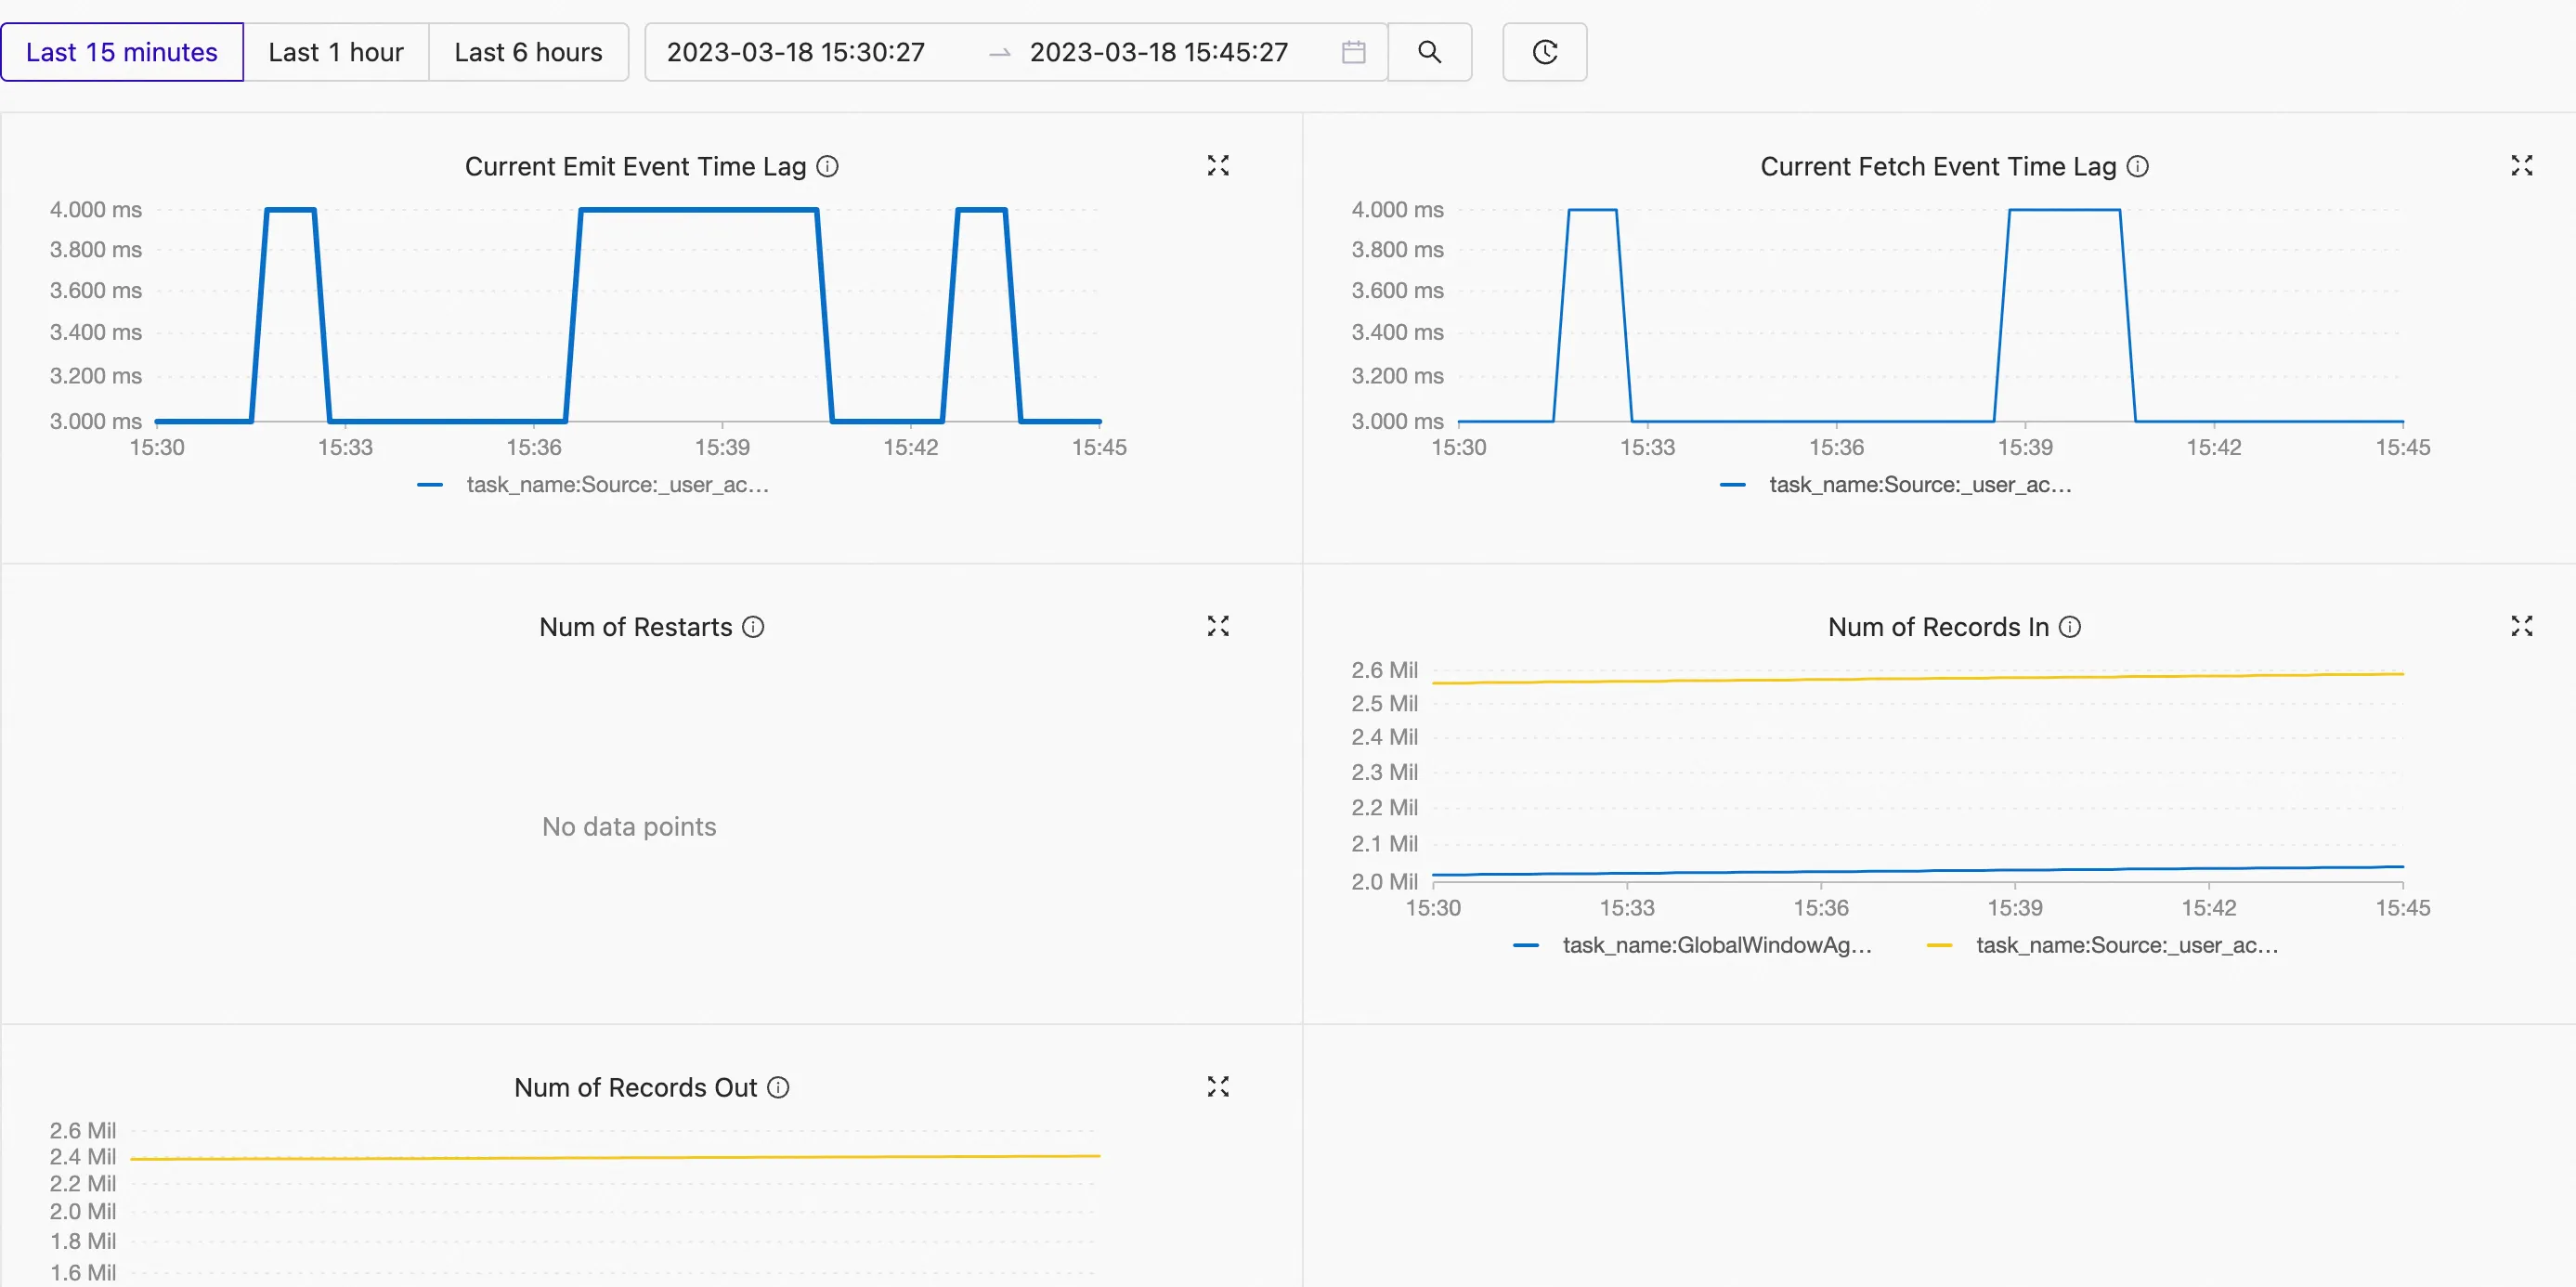
Scenario Description An operator in a deployment has backpressure. The backpressure detection feature provided by Flink, rather than metrics, is the most direct method to detect backpressure. If backpressure exists, the rate at which the source sends data to downstream operators decreases. The source has a performance bottleneck. If only the throughput of the source is insufficient, no backpressure can be detected in your deployment. The values of the Current Emit Event Time Lag and Current Fetch Event Time Lag metrics are large and close to each other. If the latency of a deployment is high, you can use the following metrics to analyze the data processing capabilities and the retention of data in the external system:
Metric Description Current Emit Event Time Lag and Current Fetch Event Time Lag Indicate the latency, you can analyze the data processing capabilities of a source based on the difference between the values of the two metrics. The difference indicates the duration for which the data is retained in the source. - If the difference between the values of the two metrics is small, the source does not efficiently pull data from the external system because of issues related to network I/O or parallelism.
- If the difference between the values of the two metrics is large, the source does not efficiently process data because of issues related to data parsing, parallelism, or backpressure.
Procedure
Log in to Ververica Cloud.
On the Dashboard page, locate the workspace you want to manage, click the title of the workspace or this icon ⋮, and select Open Console.
In the left-side navigation pane of the Console, click Deployments.
On the Deployments page, find the desired deployment and click Metrics.
View the metrics of the deployment.
For more information about the metrics that are supported by sources and sinks and the connectors that are used to report metrics.
Metrics
Overview
| Metric | Description | Details | Unit | Supported Connector |
|---|---|---|---|---|
| Num of Restarts | The number of times that a job is restarted when a job failover occurs. | This metric indicates the number of times that a job is restarted when a job failover occurs. The number of times that the job is restarted when the JobManager failover occurs is not included. This metric is used to check the availability and status of the job. | N/A | N/A |
| Current Emit Event Time Lag | The processing latency. | If the value of this metric is large, a data latency may occur in the deployment when the system pulls data or processes data. | Millisecond | Kafka |
| Current Fetch Event Time Lag | The transmission latency. | If the value of this metric is large, a data latency may occur in the deployment when the system pulls data. In this case, you must check the information about the network I/O or the source. You can analyze the data processing capabilities of a source based on the difference between the values of this metric and the Current Fetch Event Time Lag metric. |
 - If the difference between the values of the two metrics is small, the source does not efficiently pull data from the external system because of issues related to network I/O or parallelism.
 - If the difference between the values of the two metrics is large, the source does not efficiently process data because of issues related to data parsing, parallelism, or backpressure. | Millisecond | Kafka               |
| Num of Records In | The total number of input data records of all operators. | If the value of this metric does not increase for a long period of time for an operator, data may be missing from the source. In this case, you must check the data of the source. | N/A | All built-in connectors | | Num of Records Out | The total number of output data records. | If the value of this metric does not increase for a long period of time for an operator, an error may occur in the code logic of the deployment, and data is missing. In this case, you must check the code logic of the deployment. | N/A | All built-in connectors |
I/O
| Metric | Description | Details | Unit | Supported Connector |
|---|---|---|---|---|
| Num of Bytes In | The total number of input bytes. | This metric is used to check the size of the input data records of the source. This can help observe the deployment throughput. | Byte | Kafka |
| Num of Bytes Out | The total number of output bytes. | This metric is used to check the size of the output data records of the source. This can help observe the deployment throughput. | Byte | Kafka |
CPU
| Metric | Description | Details | Unit |
|---|---|---|---|
| JM CPU Usage | The CPU utilization of the JobManager. | If the value of this metric is greater than 100% for a long period of time, the CPU of the JobManager is busy and the CPU usage is high. This may affect the system performance. As a result, issues such as system stuttering and slow response occur. | N/A |
| TM CPU Usage | The CPU utilization of a TaskManager | This metric indicates the utilization of CPU time slices that are occupied by Flink. If the value of this parameter is 100%, one CPU core is used. If the value of this parameter is 400%, four CPU cores are used. If the value of this metric is greater than 100% for a long period of time, the CPU of the TaskManager is busy. If the CPU usage is high but the CPU utilization is low, a large number of processes that are in the uninterruptible sleep state may be running due to frequent read and write operations. | N/A |
Memory
| Metric | Description | Details | Unit |
|---|---|---|---|
| JM Heap Memory | The heap memory of the JobManager. | This metric is used to check the change in the heap memory of the JobManager. | Byte |
| JM NonHeap Memory | The non-heap memory of the JobManager. | This metric is used to check the change in the non-heap memory of the JobManager. | Byte |
| TM Heap Memory | The heap memory of a TaskManager. | This metric is used to check the change in the heap memory of the TaskManager. | Byte |
| TM NonHeap Memory | The non-heap memory of a TaskManager. | This metric is used to check the change in the non-heap memory of the TaskManager. | Byte |