Dashboard
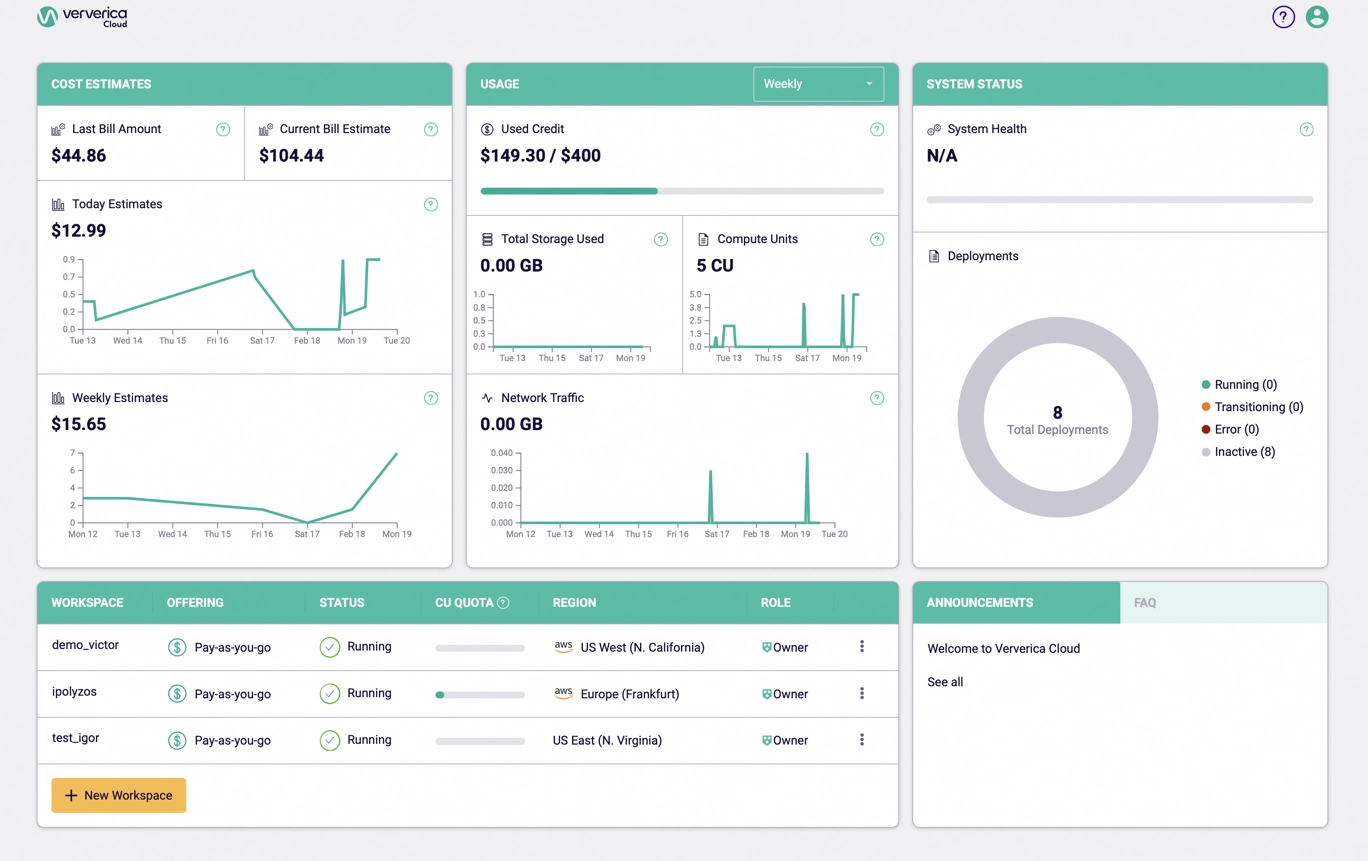
The Dashboard is your system overview, giving you access to all your workspaces, and displaying system status and resource usage. It is displayed when you log in to Ververica Cloud.
The Cost estimates and Usage sections only display information relating to workspaces owned by the currently logged-in user, whereas the Workspaces table and System status sections apply to all workspaces to which the current user has access (those they own, and those to which they have been invited to collaborate).
Dashboard tools
The following tools are located at the top right of the Dashboard:
Help menu button: Click to access Ververica support options. See Help menu.
Account menu button: Click to access the Ververica Cloud main menu options. See Account menu.
The remainder of the Dashboard display is devoted to summary information and workspace listings.
Cost Estimates
The Cost Estimates section gives you an overview of your account. It displays summary information relating to charges and billing, and allows you to make decisions on resourcing based on current estimates.
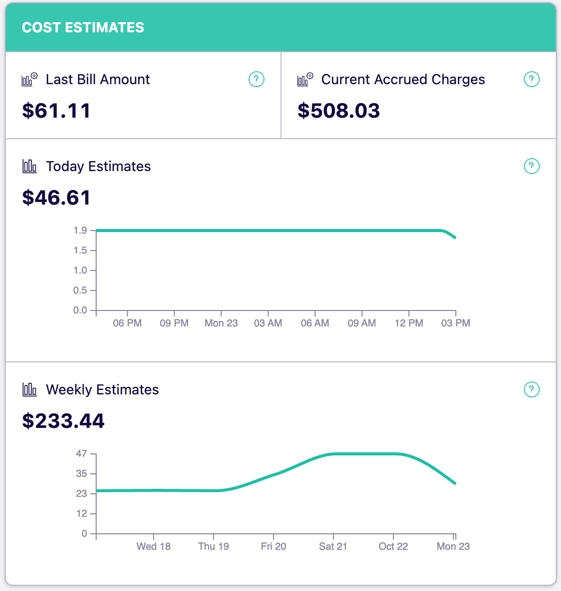
- Last Bill Amount: The amount billed in the previous billing period.
- Current Accrued Charges: An estimation of the current billing period costs.
- Today Estimates: Today's trend of cost estimates, with hourly granularity, updated every hour.
- Weekly Estimates: Weekly trend of cost estimates, with daily granularity, updated every day.
For more information on managing your billing and invoicing, see Billing.
Usage
This gives an overview of resources used by workspaces that you own.
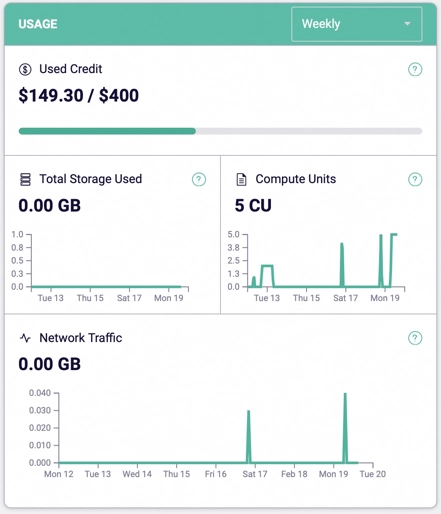
You can use the drop-down menu in the top right of the section title bar to choose between Daily, Weekly and Monthly display.

- Total Storage Used: Total Storage usage average in GB.
- Compute Units: Trend of aggregate CUs.
- Network Traffic: Trend of NT (GB) aggregate.
For all the above, depending on the menu selection (Daily, Weekly or Monthly), hourly or daily trend data is shown.
System Status
This section gives an overview of the status of all deployments on which you collaborate (those you own and those to which you have been invited to collaborate).
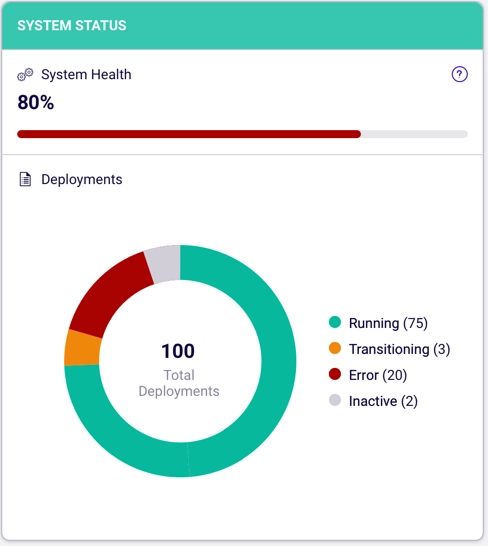
- System Health: This gives a visual representation of total system health. It is based on the overall deployment health of all the user's workspaces.
- Deployments: This shows the total number of deployments in all workspaces owned by the user, along with an overview of their job states: Running, Transitioning (starting or cancelling), Error, or Inactive.
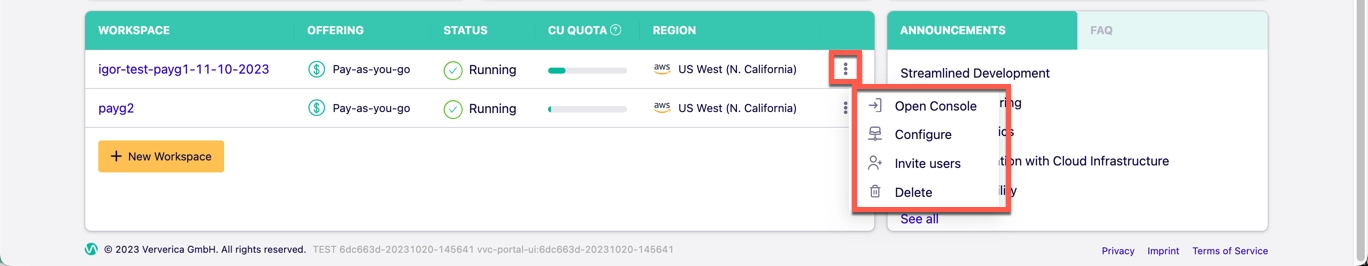
Workspace table
The Workspaces table lists all the workspaces that you own and on which you have been invited to collaborate. Information is displayed about each workspace, and there is a menu button ![]() at the righthand end of each entry providing access to workspace-related options.
at the righthand end of each entry providing access to workspace-related options.
- Workspace: Workspace name.
- Offering: Offering type (Reserved capacity or Pay-as-you-go).
- Status: Status of workspace (for more on status, see Deployment job states below).
- CU Quota: CU usage is represented by a bar. Hover the pointer over the bar to see CU usage figure.
- Region: Shows the selected region name for this workspace.
- Workspace menu button: This button
 (at the end of the workspace table entry) provides access to workspace operations (Open Console, Configure, Invite users, Delete). See Manage workspaces and (for the Configure option) Manage private connections.
- New Workspace button: Click to create a new workspace. See Create and delete workspaces for more information on managing workspaces.
Deployment job states
The Status column in the Workspace list shows job status. It can have the following values:
| State | Description |
|---|---|
| Starting | The job is starting, but has not started completely |
| Running | The job is running |
| Cancelled | When you click Cancel in the Console's Deployments tab, the job appears here as Cancelled |
| Finished | A finite flow job has completed |
| Failed | The job failed to run |
See also Deployments.