Console
You use the Ververica Cloud Console to create, run, and debug your streaming applications.
In this topic, we’ll introduce the Console’s main features.
Console overview
The following features are common to all Console modules (i.e. they are available no matter which module you are using):
- Console toolbar
- Module navigation pane
- Module working area (for example, in the figure below, the working area for the Overview module is shown)
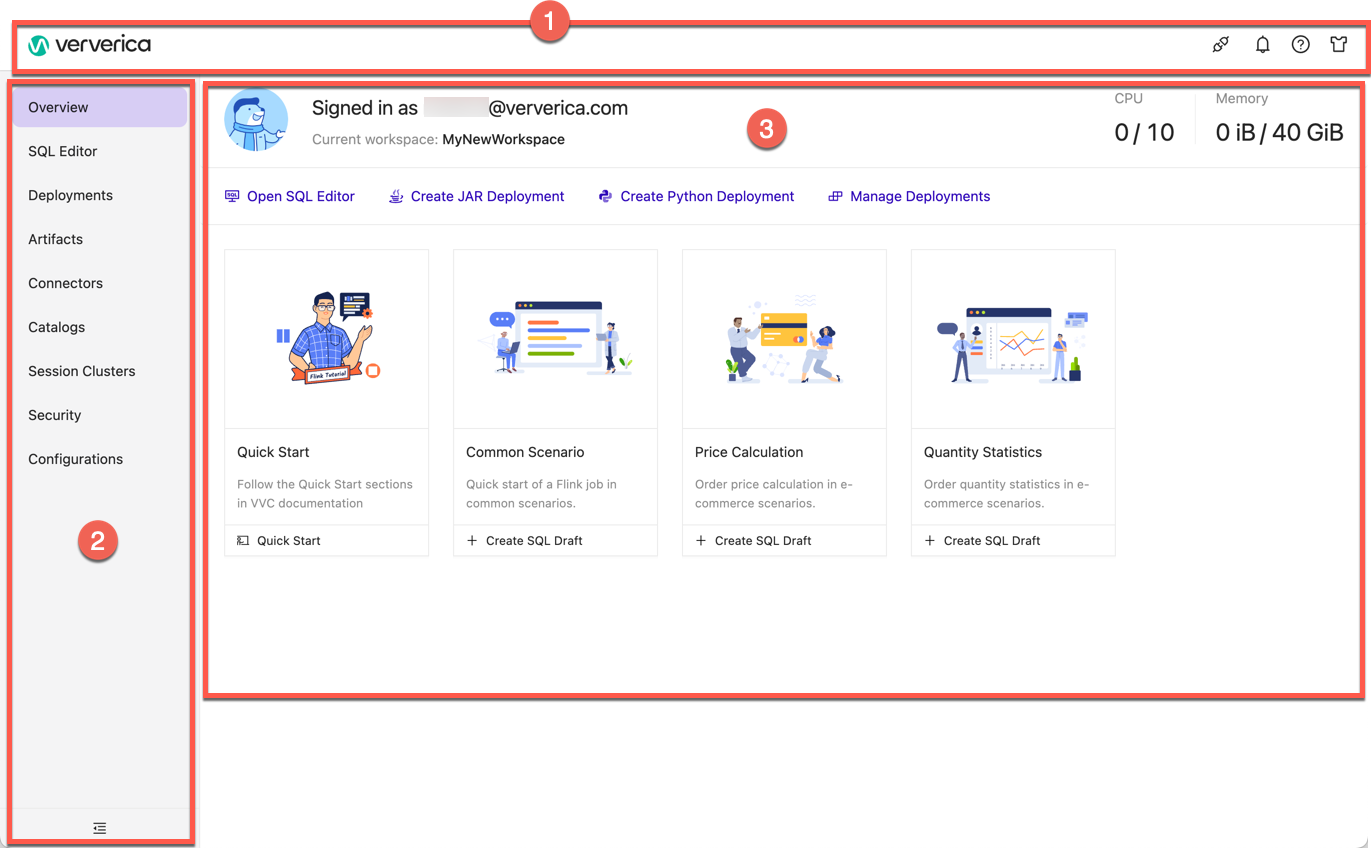
Console toolbar
This is always visible for all modules and has the following features:
Ververica logo (left of the toolbar): Click to return to your Dashboard
Console tools (right of the toolbar):
Network Detection: An IP address or a domain name can be used to check whether the running environment of a fully managed Flink deployment is connected to the upstream and downstream systems. See the FAQ section.
Notification Management: This is the hub for all notifications related to deployments.
Help: Click this to access the Ververica Cloud documentation.
Appearance: Click this to display a dialog where you can select the look and feel of the Console interface.
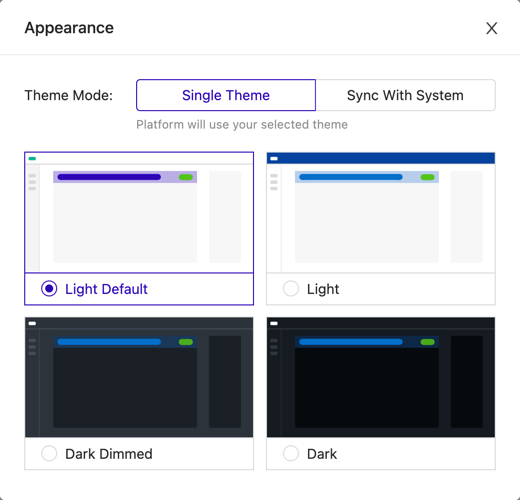 note
noteThis only controls the look and feel of the console interface. To change the overall look and feel of Ververica Cloud user interface, use the Profile option in the main Account menu (top right of the Ververica Cloud browser window).
Module navigation pane
This is always visible for all modules.
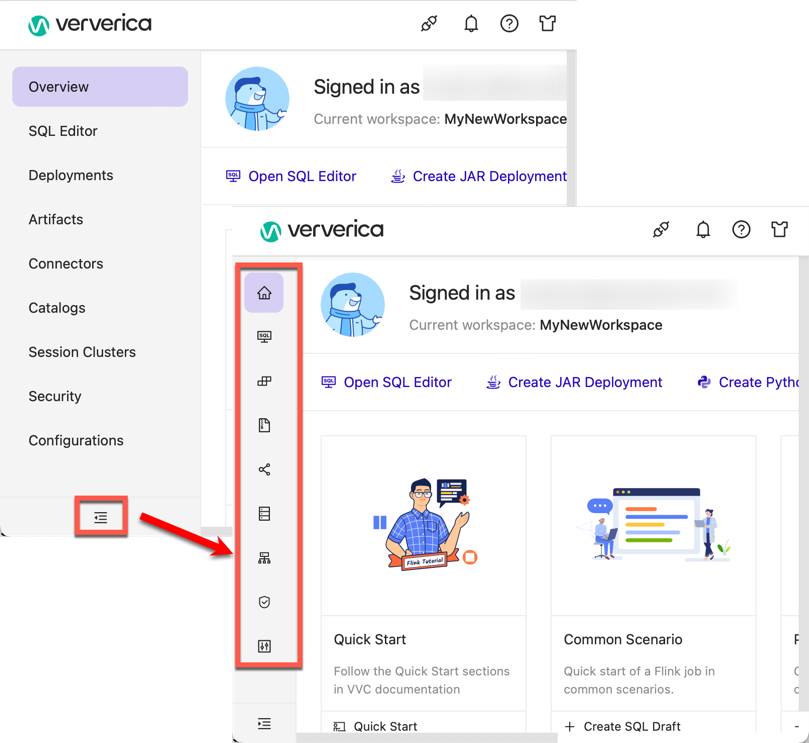
Workspace module buttons: These let you access the different Console modules (Overview, SQL Editor, etc.) These are described later in this topic.
Toggle panel display button: Click the button at the bottom of the module navigation panel to toggle between icons and full names.
Module working area: This displays module-specific elements and options. See the following subsections for more details.
Overview module
Overview displays the current workspace and provides access to useful shortcuts for creating example deployments and SQL applications from templates.
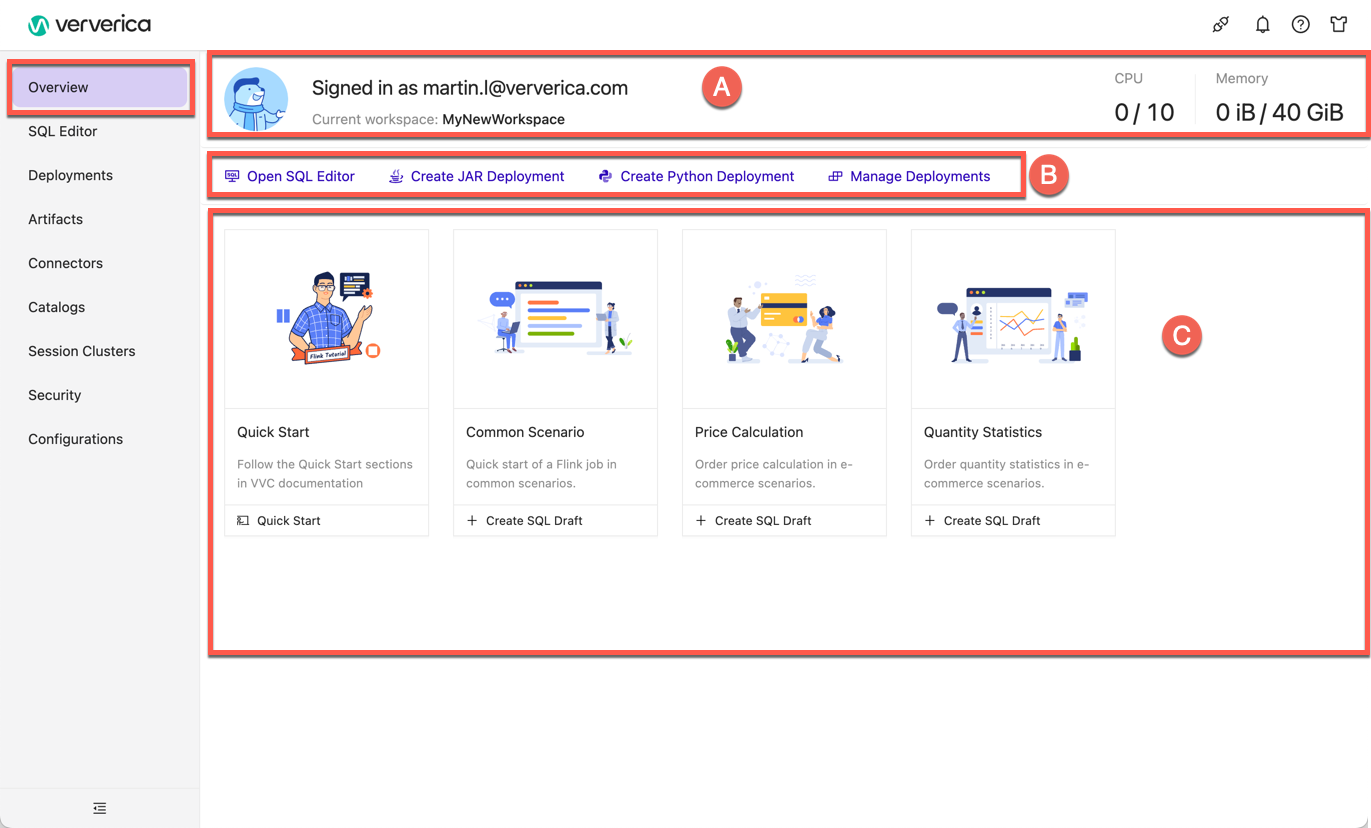
- Workspace Info pane: This shows sign-in details, current workspace name, and CPU/Memory usage.
- Workspace shortcuts:
- Open SQL Editor: Opens the SQL Editor module.
- Create JAR Deployment: This shortcut has the same effect as clicking Create Deployment in the Deployments module. It has the JAR option selected by default.
- Create Python Deployment: This shortcut has the same effect as clicking Create Deployment in the Deployments module. It has the PYTHON option selected by default.
- Manage Deployments: Opens the Deployments module, which lists any currently defined deployments.
- This pane provides a link to the Quick Start section in the Ververica Cloud documentation and starting points for some example deployment scenarios (these automatically load some pre-written SQL code into the code editor).
SQL Editor module
This is where you develop, debug, and deploy your SQL drafts.
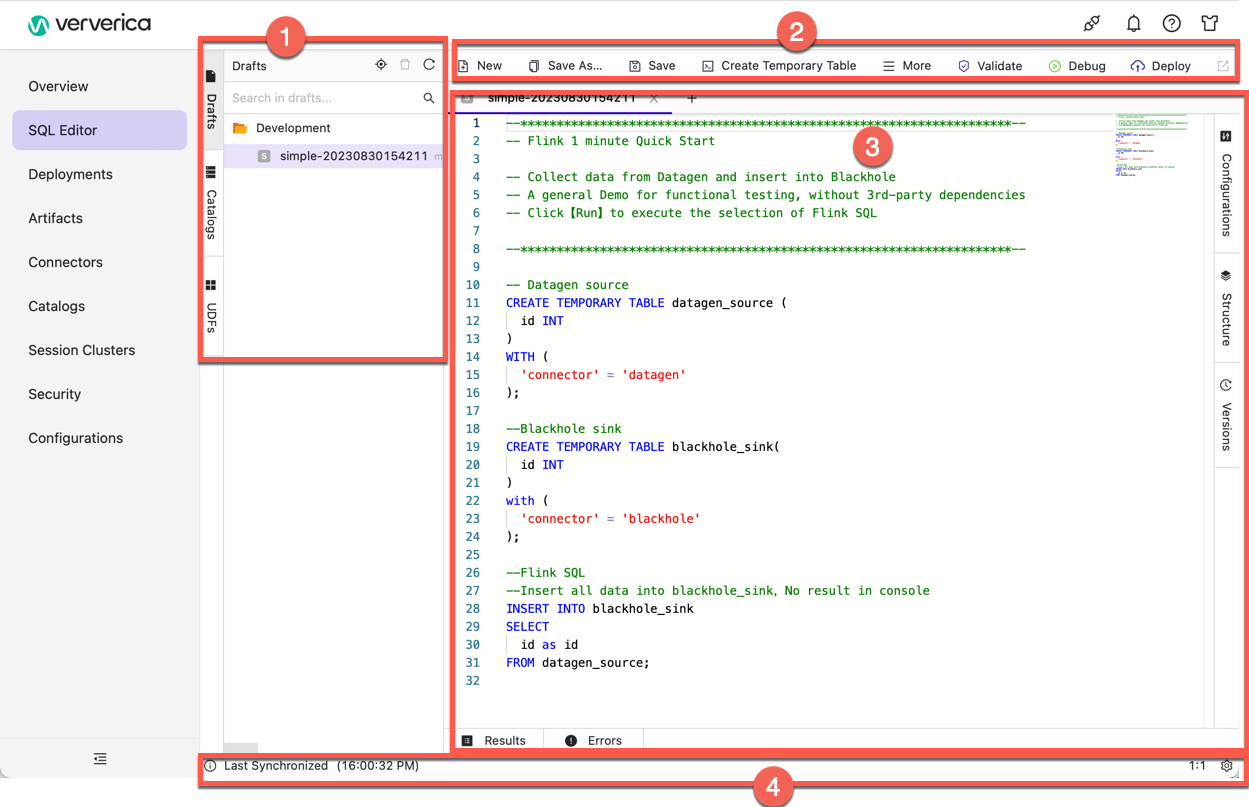
The main features shown in the image above are as follows:
- Asset list pane
- SQL Editor toolbar
- SQL Editor window
- Info bar
The following subsections give an overview of each feature.
Asset List pane
Click the tabs to display the following assets:
- Drafts: This lists all the SQL drafts you have created. Double-click on an item to load it into the SQL editor window.
- Catalogs: This lists any custom catalogs you have defined. See MySQL catalog for more information.
- UDFs: This lists any user-defined functions (UDFs) that you have registered. See Manage User-Defined Functions (UDFs) for more information.
SQL Editor toolbar
This provides tools to create and manage SQL drafts (if you have no existing drafts, only the New button will be available):
New: Click to create a new SQL draft.
Save As: Click to save the current SQL draft with a different name.
Create Temporary Table: Needs description, and links to both ways of creating (this tool, or SQL code). This might necessitate a new How-to section on Creating temporary tables.
More: This drop-down menu provides further draft-related commands:

Validate: Once you have created an SQL draft, click this to validate the code.
Debug: Allows you to debug your SQL draft.
Deploy: Click to deploy an SQL draft once it’s been validated.
SQL Editor window
This is where you edit your SQL code (double-click an SQL draft in the Asset list to open it).
These tabs provide different views and overview information about the current SQL draft:
Configurations: This lists the Engine version for the current SQL draft and any Additional Dependencies.
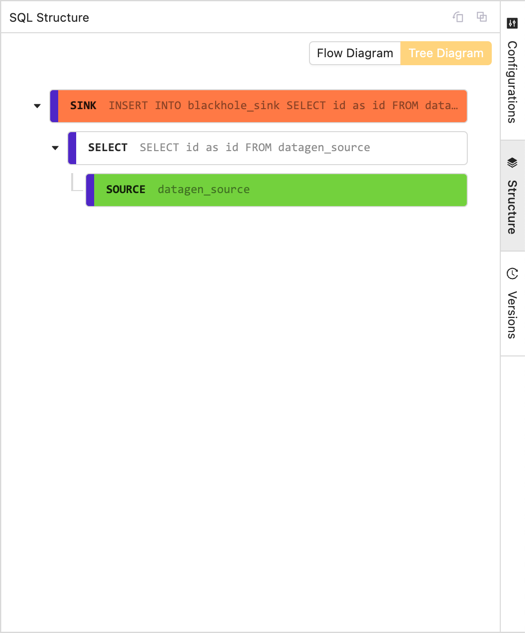
Structure: This gives you two possible views on the draft structure (flow diagram, and tree diagram):
Flow diagram Tree diagram 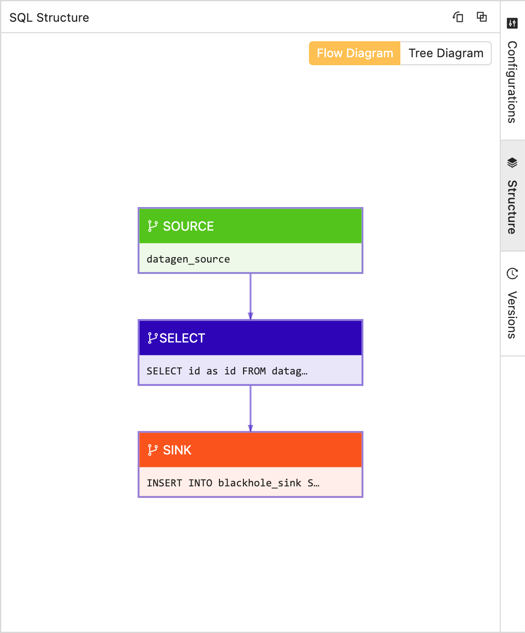
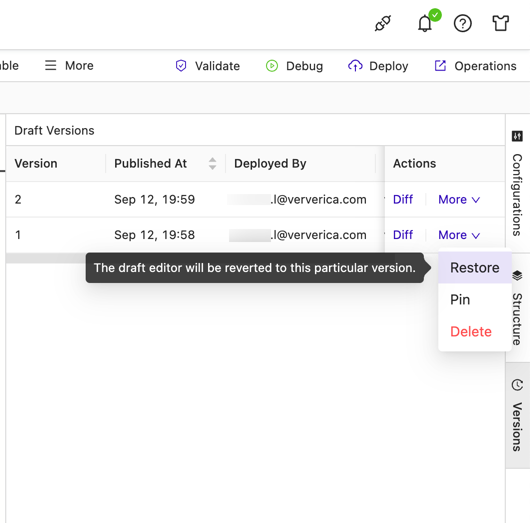
Versions: Each time you click Deploy for an SQL draft, Ververica Cloud creates a new version. This tab lists all published versions of the current SQL draft. Use the Actions menu options to work with versions. See Manage published job versions for more information.
Use the Results and Errors tabs to diagnose and optimize your SQL applications.
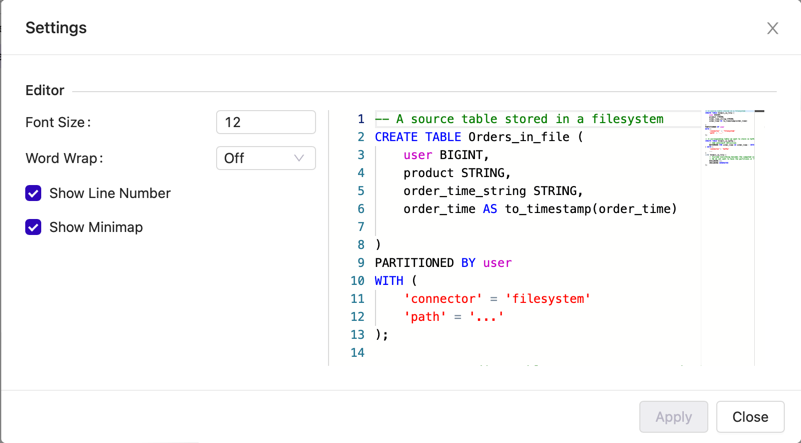
SQL Editor Info bar
This bar at the bottom of the SQL Editor module shows the Last Synchronised time. Click the settings button (the gear icon) on the right to display the Settings dialog, which allows you to change how text is displayed in the SQL Editor window.
Deployments module
This lists all the deployments (Flink applications) in your current workspace.
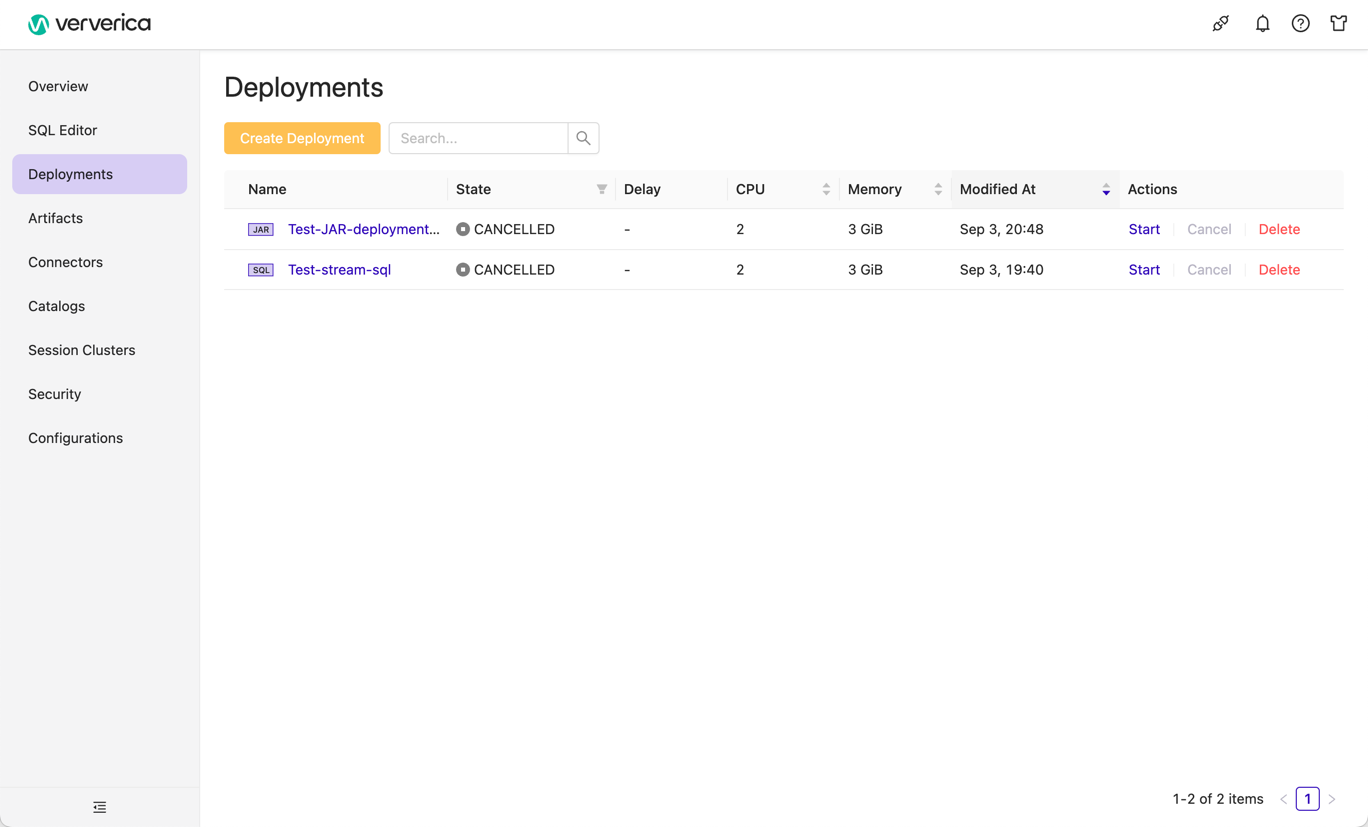
You can:
- Create a new deployment.
- Start, Cancel, or Delete an existing deployment.
- Click on a deployment name to view further options and information.
For more information about deployments, see Manage deployments.
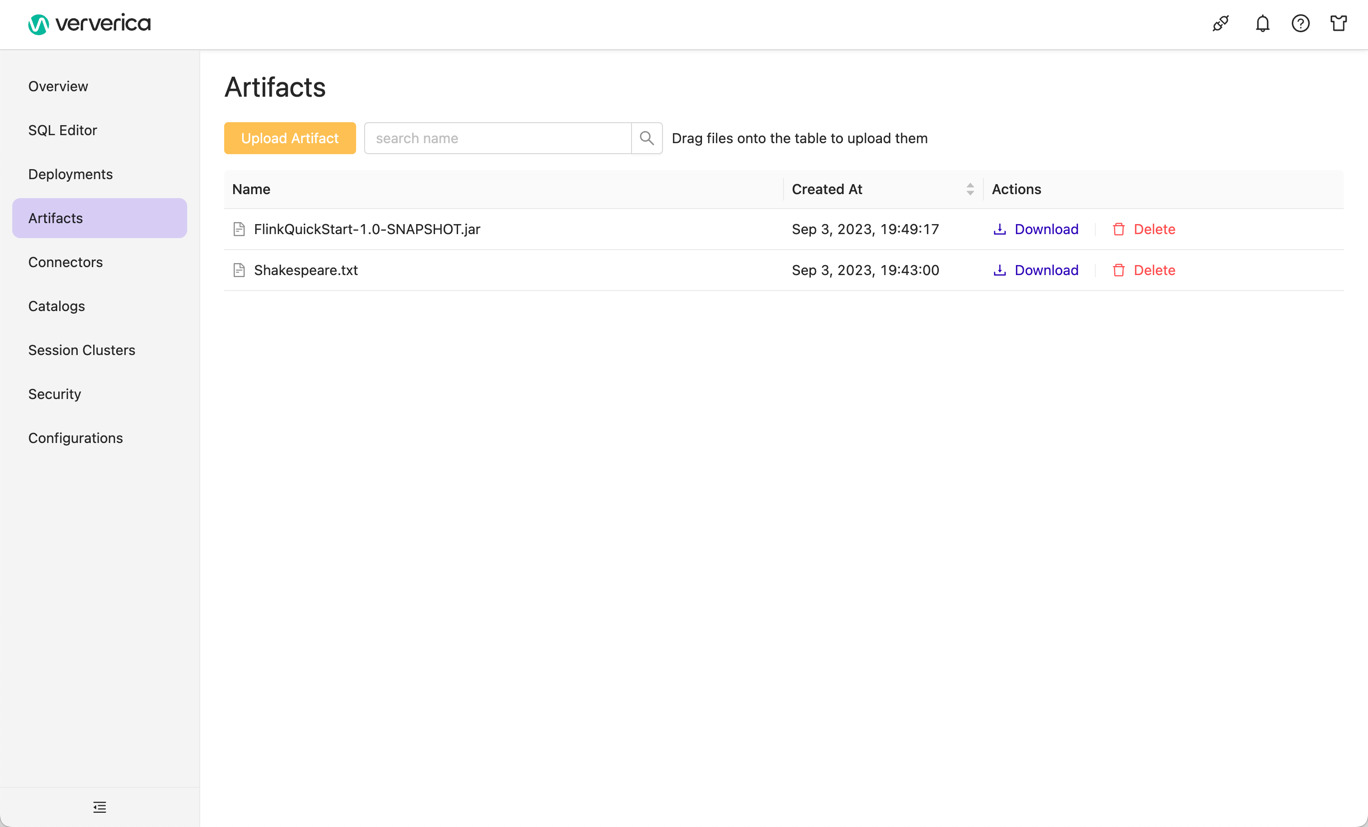
Artifacts module
Ververica Cloud provides simple file storage per workspace, enabling you to upload and reference files in Deployments. You manage these using the Artifacts module.
See Artifacts for more information.
Connectors module
Apache Flink provides a variety of built-in connectors and data formats to facilitate the integration of Flink with different data sources and sinks (also called destinations). You can also create custom connectors and formats.
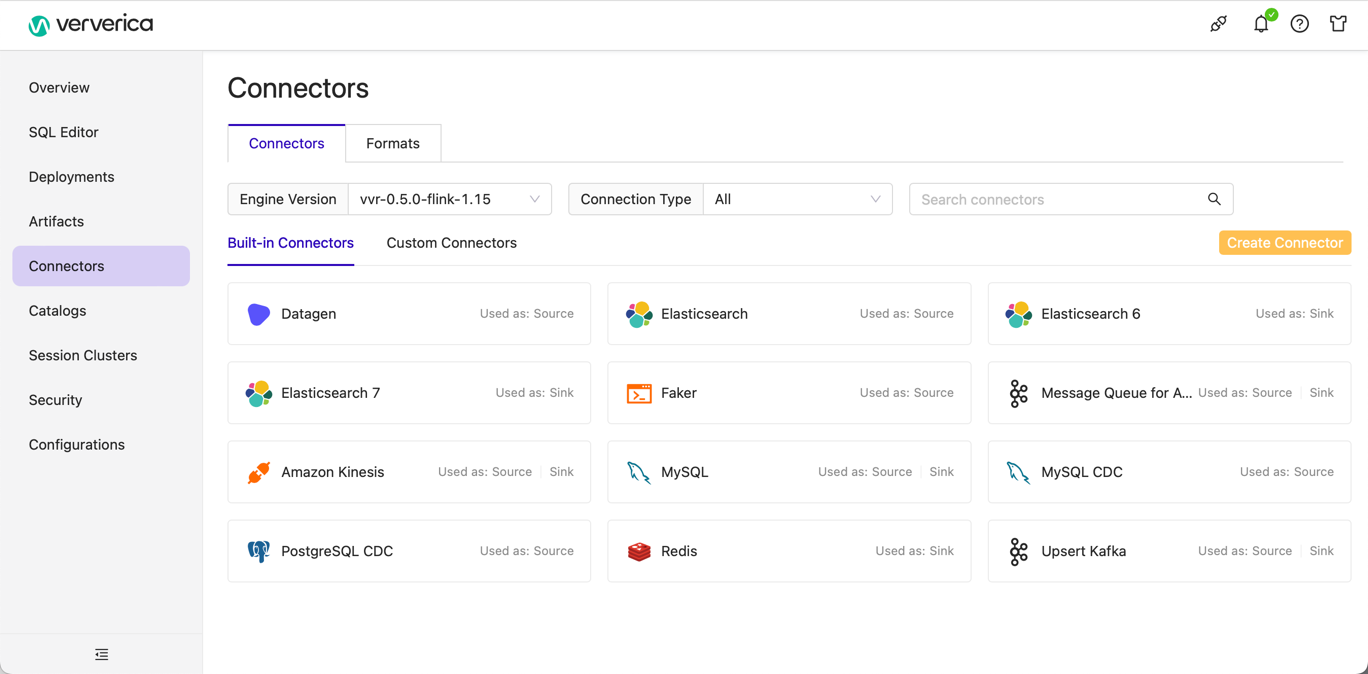
- Connectors tab: This lists the available built-in and custom connectors
- Formats tab: This lists the available built-in and custom data formats available in Ververica Cloud
See the following for more information:
- See Connectors and formatsfor more information.
Catalogs module
This module controls metadata management. It allows you to view, manage, and create catalogs stored in the current Ververica Cloud workspace.
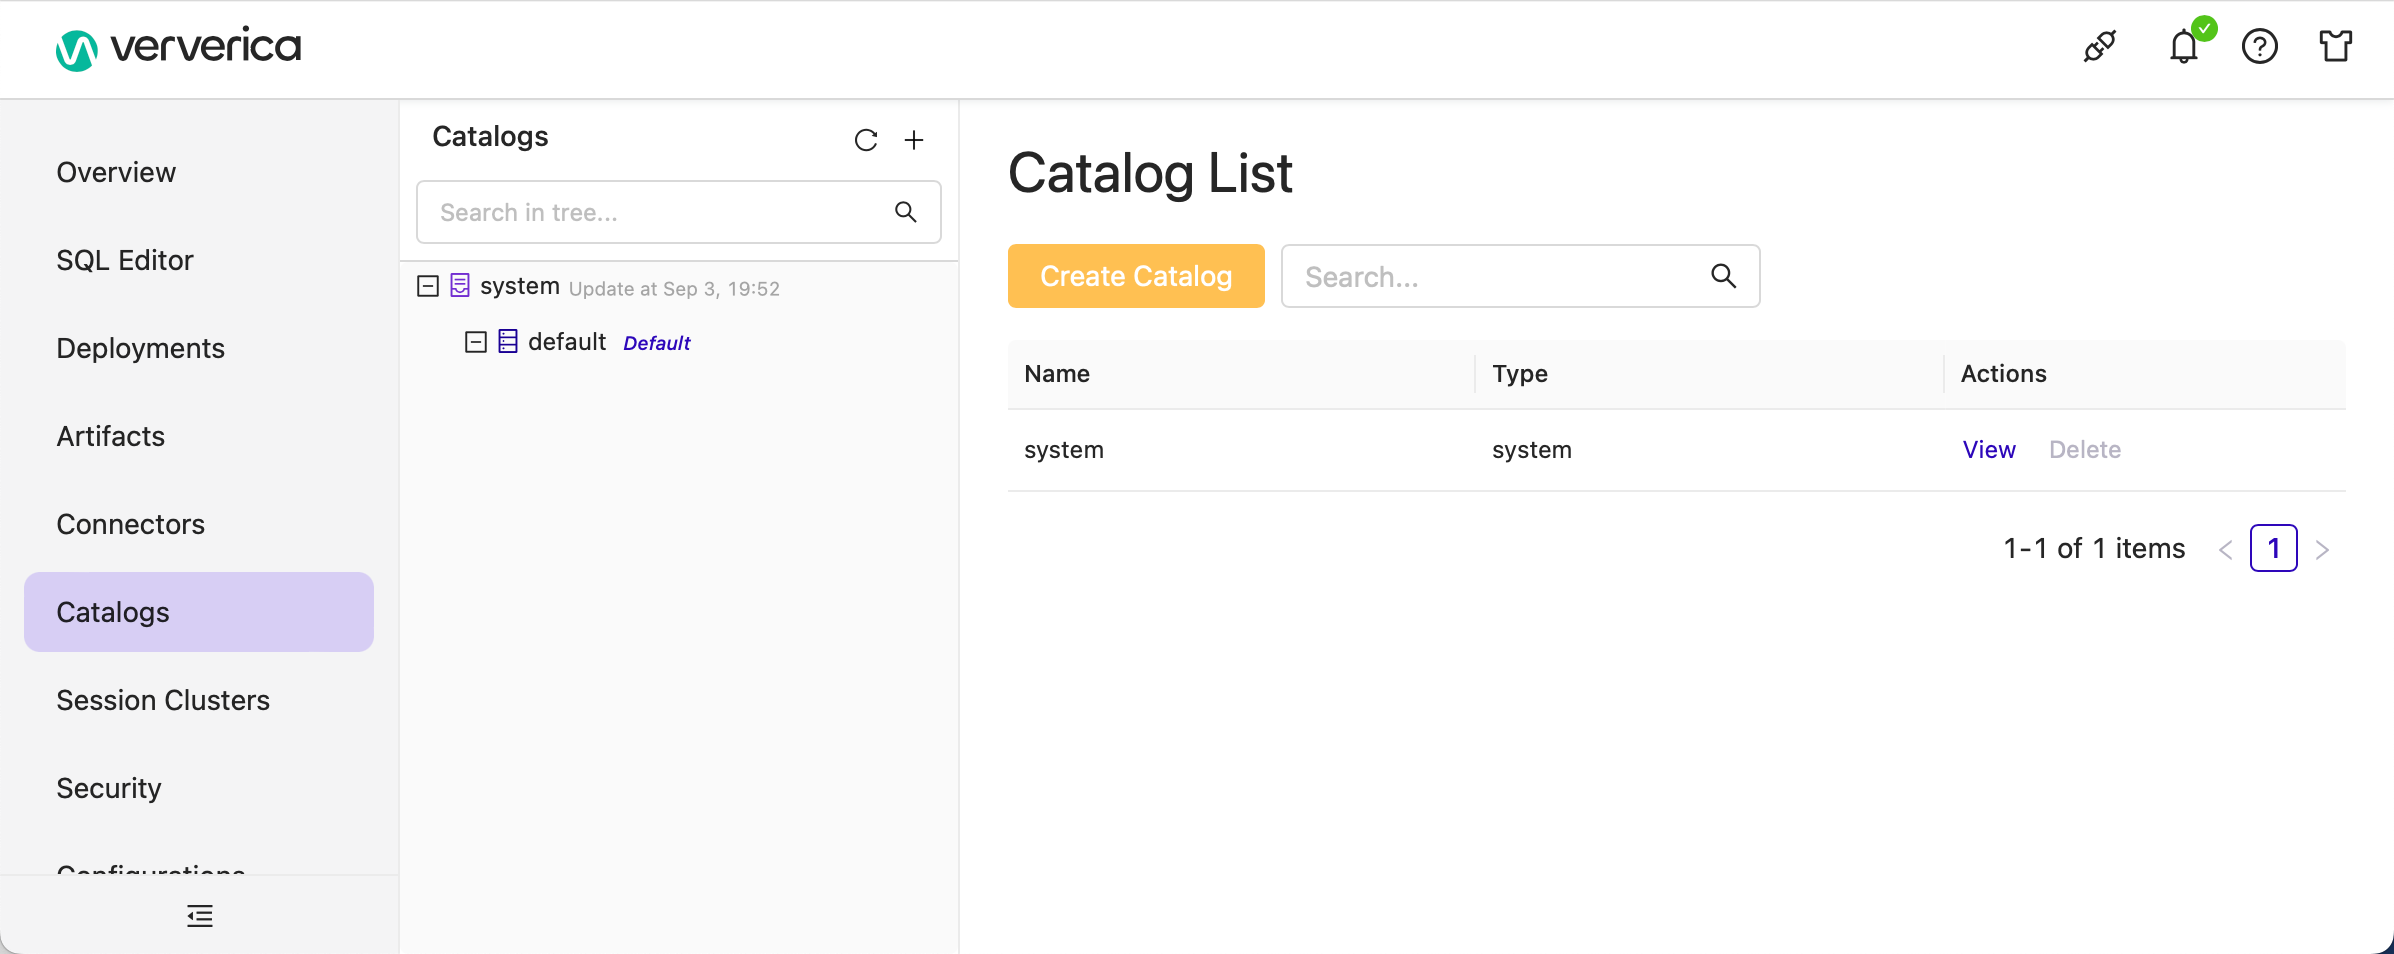
- Catalogs tree view: Use this to navigate through your saved catalogs.
This is the same as displaying the Catalogs asset list in the SQL Editor.
- Catalog List pane: Use this to view, create, and delete catalogs.
See the following for more information:
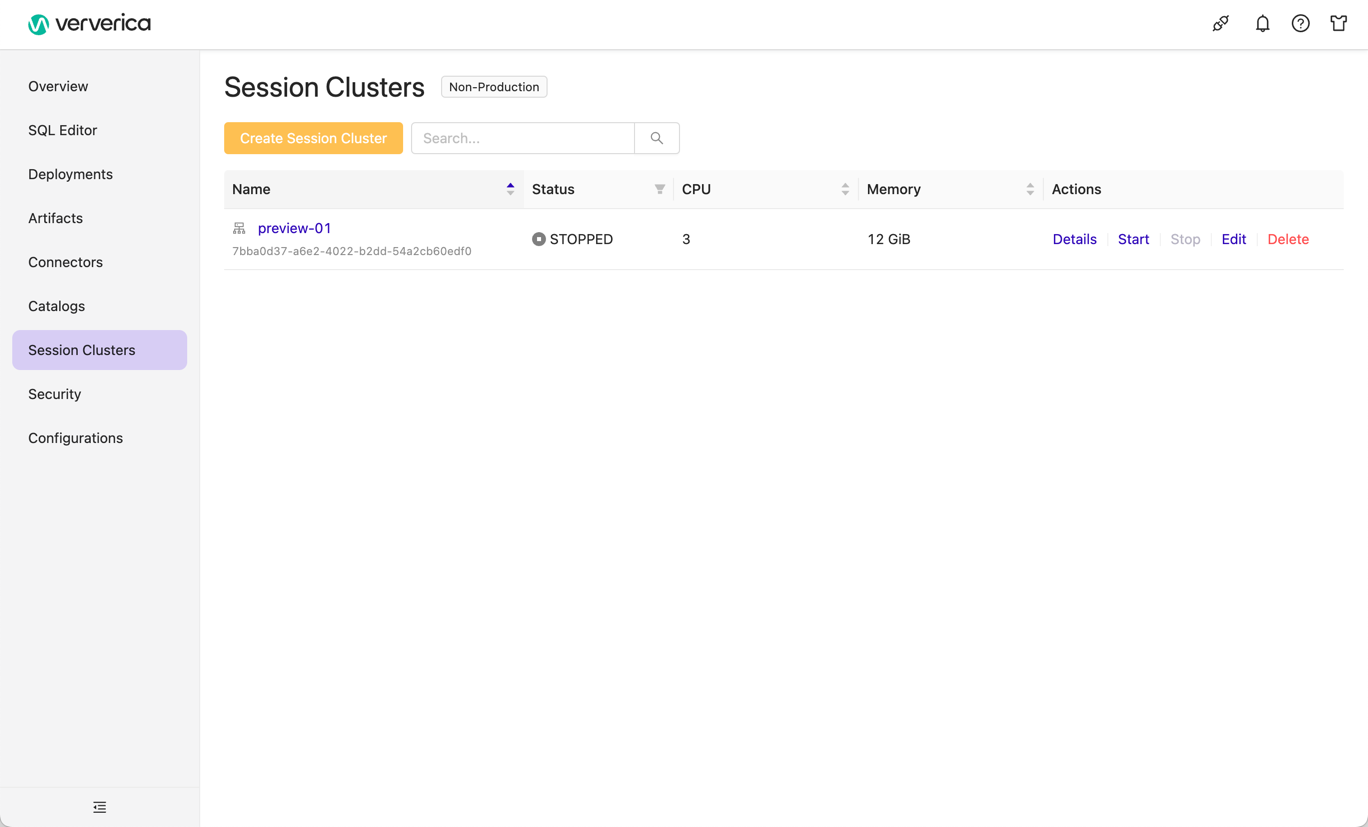
Session Clusters module
This module allows you to create, edit, delete, and view Session clusters. Session clusters are suitable for development and test purposes in non-production environments.
See Session Clusters for more information.
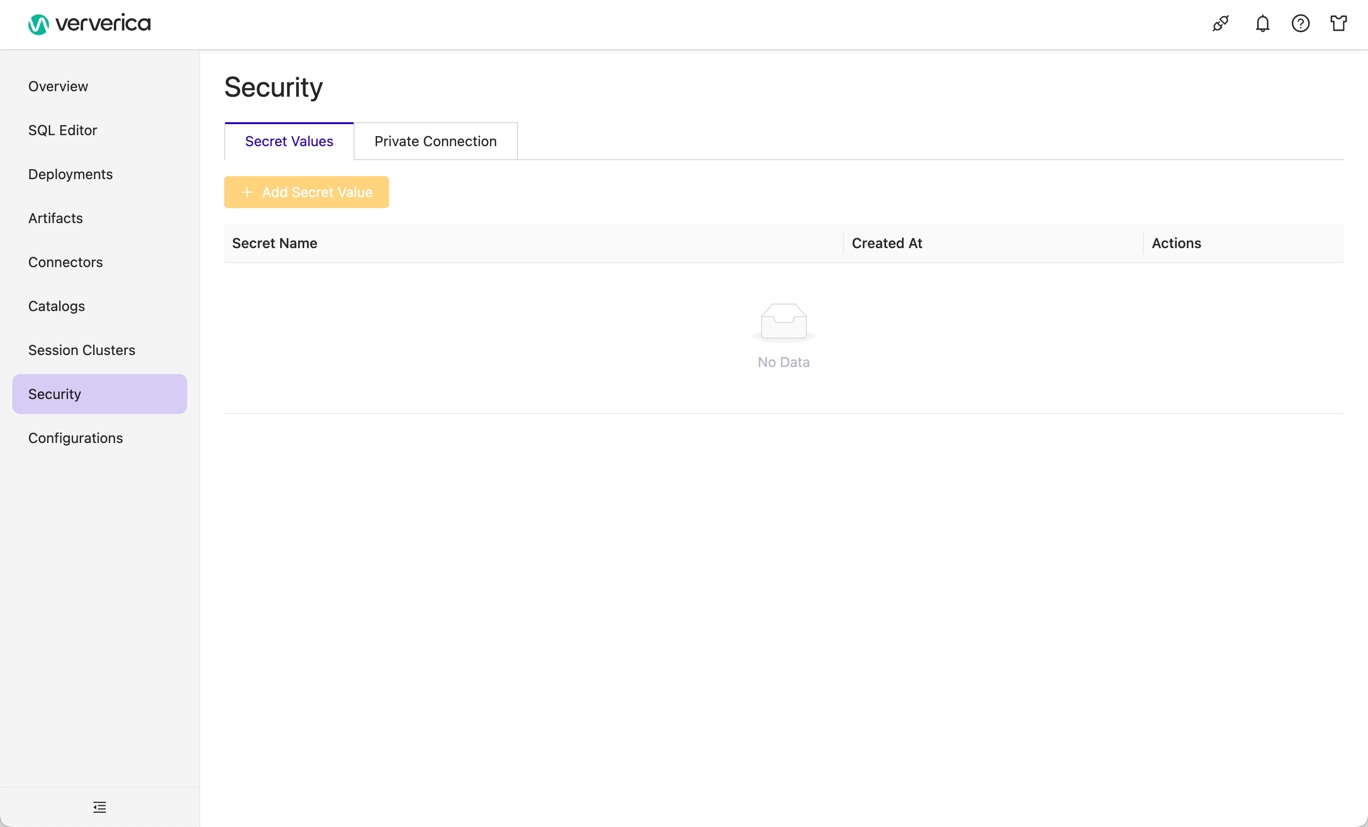
Security module
This allows you to configure various security settings for managed Flink deployments:
- Secret Values: Once created, you can reference variables in SQL scripts, in deployment parameters, or the Configuration options for a Flink deployment.
See Security for more information.
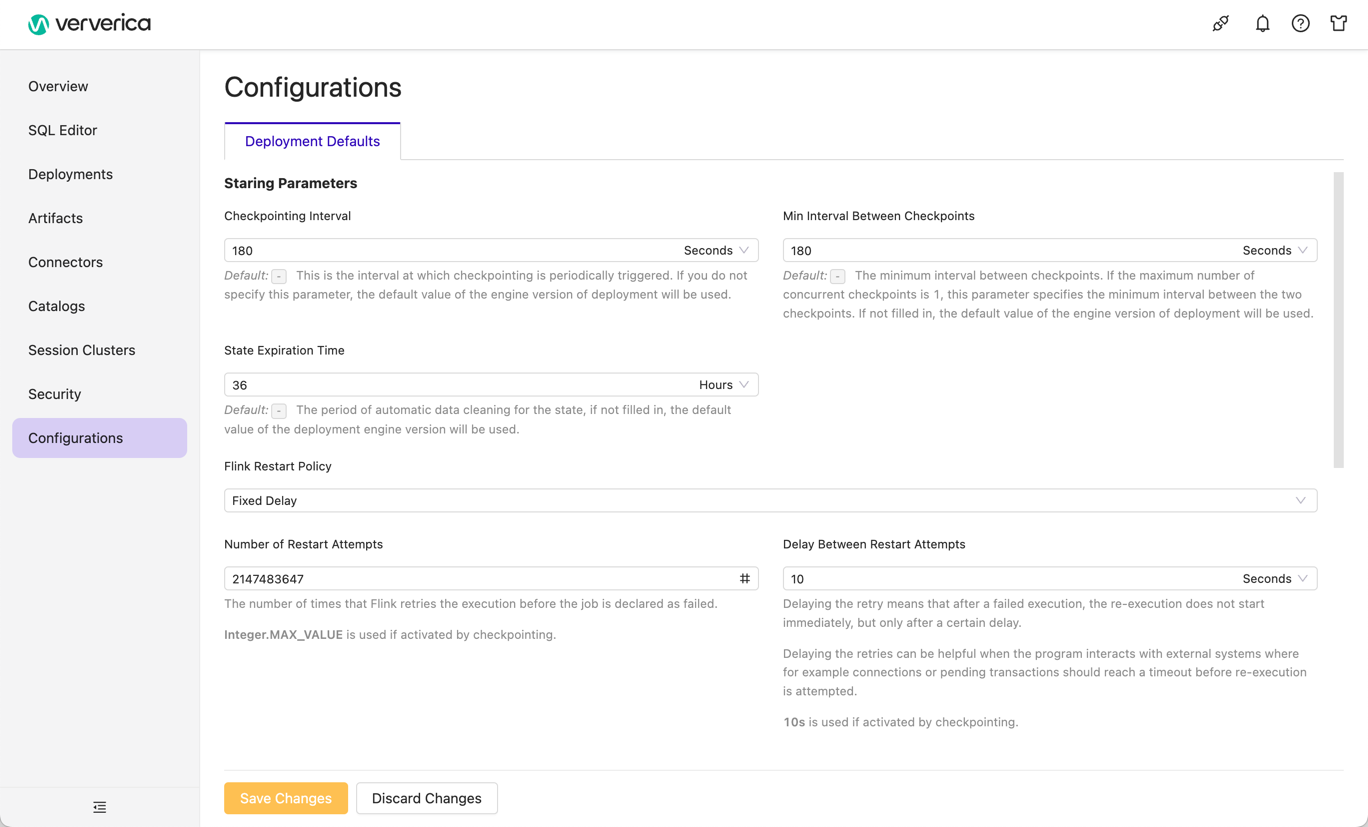
Configurations module
This module lets you view and modify deployment defaults, making job development more efficient.
For more information, see Optimize deployment default settings.